
Selective migration of Ru atoms onto CeO2 into an atomically dispersed structure
CeO2-C materials were prepared to obtain CeO2 domains with optimal surface redox properties. An amorphous carbon template with a high surface area was coated with CeO2 to control the domain size of CeO2. Carbon was impregnated with cerium precursors. The samples were annealed under N2 at 300, 550, and 700 °C, and are denoted as CeO2-C_300, CeO2-C_550, and CeO2-C_700, respectively. The crystallinity and domain size of CeO2 varied with the annealing temperature and were examined using X-ray diffraction (XRD) and transmission electron microscopy (TEM) (Supplementary Figs. 1 and 2). Lower annealing temperatures resulted in smaller crystalline domains. CeO2-C_300 exhibited less crystalline and smaller-sized CeO2, whereas CeO2-C_700 exhibited larger and more defined particles. Ce 3d and O 1s X-ray photoelectron spectroscopy (XPS) spectra confirmed that the smaller domains contained a higher concentration of surface defects (Supplementary Fig. 3). The fractions of Ce3+ and Oads increased with a decreasing domain size, indicating the formation of more oxygen vacancies and undercoordinated sites. The reducibility of the surface oxygen was evaluated using H2-temperature-programmed reduction (H2-TPR, Supplementary Fig. 4). The peak onset temperature indicated surface oxygen activation, and the peak area was used to estimate the amount of reduced oxygen. CeO2-C_550 exhibited the lowest onset temperature and largest reduction peak, indicating the highest surface reducibility. CeO2-C_550 contained more active oxygen species than CeO2-C_300 and CeO2-C_700, leading to the selection of CeO2-C_550 as the optimal support. All subsequent ruthenium catalysts were synthesized and analyzed using CeO2-C_550. Ruthenium was impregnated into CeO2-C_550 and treated with N2. The resulting material was denoted as Ru/CeO2-C_N2. This catalyst was further treated at 500 °C for 1 h in either 100% NH3 or 50% H2/Ar and denoted as Ru/CeO2-C_NH3 and Ru/CeO2-C_H2, respectively. XRD analyses of the Ru/CeO2-C-based catalysts confirmed that CeO2 remained dispersed on the carbon support without significant aggregation, regardless of the thermal treatment process (Supplementary Fig. 5). The ruthenium content in the Ru/CeO2-C-based catalysts was 1.6 wt%, as determined using ICP-OES, and all the samples exhibited high surface areas >280 m2/g (Supplementary Table 1). The Ru/CeO2 and Ru/C catalysts had Ru contents of 1.8 and 1.7 wt%, with surface areas of 31.0 and 816.3 m2/g, respectively.
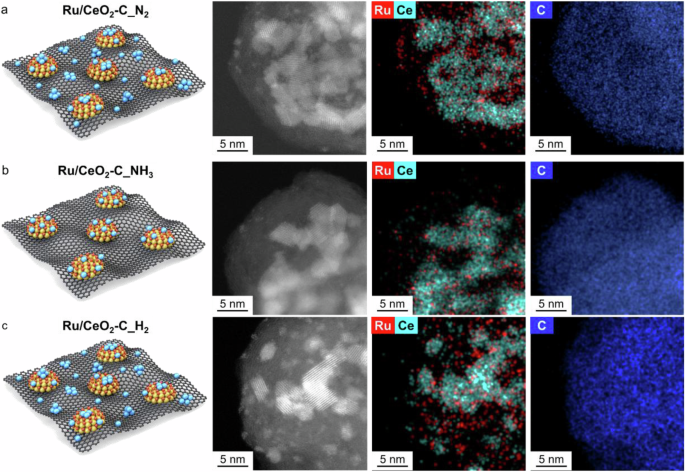
The spatial distribution and local structure of ruthenium were analyzed using ultrahigh-resolution double Cs-corrected TEM (UHR-TEM) with multichannel energy-dispersive X-ray spectroscopy (multi-EDS). The ruthenium species in Ru/CeO2-C_N2 were randomly distributed over both the CeO2 and carbon domains. They existed either in an atomically dispersed form or as nanoparticles (Fig. 1a and Supplementary Fig. 6). After the NH3 treatment, most of the ruthenium located on the carbon disappeared, and ruthenium selectively migrated toward the CeO2 domains. Only a trace amount of Ru was still detected on the carbon regions together with Ce signals, although the corresponding intensities were significantly lower than those observed on ceria domains (Fig. 1b and Supplementary Fig. 7). In contrast, the H2 treatment formed randomly located Ru nanoparticles on both carbon and CeO2, with mixed sizes (Fig. 1c and Supplementary Fig. 8). Supplementary Fig. 9 shows additional TEM images. To further examine the structure of Ru species on CeO2, UHR-TEM images were taken at higher magnification (Supplementary Fig. 10). The CeO2 lattice was clearly resolved, and no Ru nanoparticles or sub-nanometer clusters were observed. Instead, some isolated bright features were detected along with the ceria domains, consistent with atomically dispersed Ru species. These results suggest that NH3 treatment enables selective migration with atomic dispersion of ruthenium onto CeO2, whereas H2 treatment leads to aggregation into small clusters or nanoparticles at random locations. The deposition of ruthenium on CeO2 and carbon and treatment with NH3 caused it to exist as nanoparticles (Supplementary Fig. 11).

UHR-TEM and corresponding multi-EDS mapping images for a Ru/CeO2-C_N2, b Ru/CeO2-C_NH3, and c Ru/CeO2-C_H2.
X-ray absorption fine structure (EXAFS) results confirmed the atomic feature of Ru/CeO2-C_NH3 (Fig. 2a). Notably, because the scattering paths of Ru–O, Ru–N, and Ru–C are difficult to distinguish owing to their similar bond lengths and backscattering amplitudes, all such first-shell coordinations will hereafter be referred to as Ru–O36,37. Ru/CeO2-C_NH3 exhibited a distinct Ru–O coordination peak at approximately 1.6 Å, while no Ru–Ru peak was observed near 2.4 Å, indicating that ruthenium existed in an atomically dispersed state on the CeO2 surface. In contrast, Ru/CeO2-C_H2, Ru/CeO2, and Ru/C exhibited both Ru–O and Ru–Ru coordination peaks, indicating surface Ru nanoparticles. Fitting results revealed Ru–Ru coordination numbers of 0.3 and 1.7 for Ru/CeO2-C_NH3 and Ru/CeO2-C_H2, respectively (Supplementary Fig. 12 and Supplementary Table 2). The electronic state of ruthenium was examined using X-ray absorption near-edge structure (XANES) analyses (Fig. 2b). Ru/CeO2-C_NH3 exhibited a slightly higher white-line intensity than Ru/CeO2-C_H2, and both exhibited higher intensities than Ru foil, Ru/CeO2, and Ru/C.

a EXAFS and b XANES Ru K-edge results. c H2-TPR results for the ruthenium catalysts. d Raman spectra for Ru/CeO2-C_NH3 and Ru/CeO2-C_H2.
In addition to the XAS results, H2-TPR analyses were performed to gain deeper insight into the surface reducibility of the catalysts and their metal-support interactions (Fig. 2c). Ru/CeO2 exhibited a small reduction peak at 123 °C, while Ru/C exhibited no reduction peak. Ru/CeO2-C_NH3 exhibited a single broad reduction peak at 157 °C, whereas Ru/CeO2-C_H2 exhibited two distinct peaks at 89 and 112 °C. The higher reduction temperature of Ru/CeO2-C_NH3 indicates that Ru forms strong interactions with CeO2, likely as Ru–O–Ce species. In contrast, the peaks at lower temperatures for Ru/CeO2-C_H2 suggest the presence of weakly bound ruthenium nanoparticles or clusters on CeO2. Notably, Ru/CeO2-C_NH3 also exhibited a larger reduction peak area, indicating a greater amount of reducible oxygen species. This feature suggests the presence of a higher density of redox-active interfaces in the catalyst, which are associated with surface defect concentration. Such an increase in reducible oxygen is expected to enhance redox cycling at the Ru–CeO2 interface, potentially facilitating hydrogen adsorption-desorption dynamics and mitigating hydrogen accumulation on Ru sites. To further probe the oxygen-related surface properties, cryo-TPO was conducted (Supplementary Fig. 13). Both catalysts exhibited oxygen uptake starting from −95 °C, indicating that the Ru surface can be readily oxidized even at very low temperatures. Notably, Ru/CeO2-C_NH3 showed a larger oxygen uptake with an additional low-temperature shoulder feature compared to Ru/CeO2-C_H2, suggesting a higher density of oxygen-taking Ru species. This result is consistent with the formation of strongly interacting and highly dispersed Ru species on CeO2, leading to a more oxygen-rich interfacial environment. Overall, the combined H2-TPR and cryo-TPO results support that Ru/CeO2-C_NH3 possesses a higher density of redox-active interfacial oxygen species.
Enhanced interaction with Ru and CeO2 was also confirmed with Raman spectra (Fig. 2d). The peak at 465 cm−1 in the Raman spectra indicates an octahedrally symmetrical vibration mode of CeO2 (F2g), and that at 600 cm−1 indicates a defect-induced mode (D). Furthermore, the peaks observed at 690 and 971 cm−1 were attributed to Ru–O–Ce (Ru) interactions38,39,40,41. Those peaks were not observed in the Raman spectrum of CeO2-C (Supplementary Fig. 14). The intensity ratios of these peaks (ID/IF2g and IRu/IF2g) were estimated to compare the surface defect concentration and interaction between Ru and CeO2. The surface defect concentration was higher for Ru/CeO2-C_NH3, as also confirmed by the Ce 3d and O 1s XPS profiles (Supplementary Fig. 15). IRu/IF2g was also higher for Ru/CeO2-C_NH3 than for Ru/CeO2-C_H2, indicating that NH3-treated Ru/CeO2-C exhibited more interaction between ruthenium and CeO2. Collectively, these results indicate that NH3 treatment may induce atomic dispersion of ruthenium on the CeO2 surface, leading to the formation of Ru–O–Ce interactions.
Driving force of Ru migration during NH3 treatment
To identify the driving force behind ruthenium migration during NH3 treatment, the influence of the active intermediate species generated during NH3 decomposition was examined. Nitrogen-doped carbon (N–C) was first synthesized and deposited with a target amount of 2 wt% Ru. Nitrogen incorporation into the carbon matrix of N–C was confirmed using N 1s XPS (Supplementary Fig. 16). The resulting material was then reduced under a 10% H2/Ar gas condition at 500 °C for 1 h to evaluate the effect of H and surface-doped N species. Hydrogen can transform the catalyst structure by inducing active metal mobility or surface defect formation, and surface N-doped structures can form stoichiometrically unstable environments that serve as anchoring sites42,43. The TEM images of the resulting Ru/N–C (H2) revealed highly aggregated ruthenium nanoparticles (Fig. 3a, left), suggesting that the surface-doped nitrogen and hydrogen-derived active intermediates were insufficient to disperse ruthenium. To assess the effect of nitrogen-containing intermediates, the H2-treated Ru/N–C sample was further exposed to NH3 at 500 °C for 1 h. NH3 treatment caused the previously aggregated ruthenium particles to disappear (Fig. 3a, middle), and high-angle annular dark-field scanning transmission electron microscope (HAADF-STEM) analyses confirmed that the ruthenium species were redistributed into smaller particles (Fig. 3a, right). These results indicate that the active-nitrogen-containing species generated from NH3 decomposition acted as the key driving force for ruthenium mobilization.

a TEM images of Ru/N-doped carbon (N–C) after H2 reduction (left) and after a subsequent NH3 treatment (middle), along with the corresponding HAADF-STEM image (right). b NH3 decomposition results on the ruthenium base catalysts and bare supports pretreated in N2. NH3 decomposition was performed at a gas flow of 100% NH3 with a WHSV of 30,000 mL/gcat·h. c N 1s XPS spectra of the NH3-treated catalysts and supports.
As ruthenium migration is likely driven by its interaction with nitrogen-based intermediates, it was hypothesized that the stabilization sites of these nitrogen species would correlate with the anchoring sites of the mobilized ruthenium. To test this hypothesis, various ruthenium catalysts and their corresponding supports were treated under similar conditions with comparable NH3 decomposition rates (Fig. 3b). Blank test result using the quartz reactor is shown in Supplementary Fig. 17. N 1s XPS measurements were conducted to determine the nitrogen incorporation after treatment. As shown in Fig. 3c, nitrogen doping was observed only in the samples containing CeO2 (Ru/CeO2-C, Ru/CeO2, and CeO2-C), whereas no significant nitrogen signals were detected for Ru/C or the bare carbon support. The N 1s spectrum was deconvoluted into three components N-1 (398.3 eV), N-2 (400.1 eV), and N-3 (402.3 eV). The N-1 peak is assigned to substitutional nitrogen (i.e., N replacing lattice oxygen) and/or surface NH species, the N-2 peak to interstitial nitrogen species and/or NH2 species, and the N-3 peak to chemisorbed NH3, NH4+ species, or oxidized nitrogen species (e.g., NOx)44,45,46,47,48. The largest N 1s XPS peak appeared at 400.1 eV, suggesting that nitrogen-containing species preferentially incorporated as an interstitial structure, or *NH2 species adsorbed on CeO2 domains, thereby guiding the migration and anchoring of ruthenium onto CeO2 surfaces. Notably, this behavior is distinct from that observed for ruthenium supported on nitrogen-doped carbon, in which nitrogen species predominantly exist as substitutes rather than interstitial nitrogen (Supplementary Fig. 16).
To further resolve the temporal evolution of this process, time-resolved UHR-TEM and N 1s XPS analyses were conducted. Ru/CeO2-C_N2 was exposed to NH3 at 500 °C for varying durations (1, 5, 10, 20, and 40 min), followed by rapid quenching (Supplementary Fig. 18). At early stages (1 and 5 min), Ru species remained broadly distributed, including on carbon domains. A pronounced redistribution occurred between 5 and 10 min, where Ru signals on carbon decreased and became increasingly localized on CeO2 domains. With prolonged treatment, Ru species were predominantly associated with CeO2, indicating structural stabilization. Consistently, time-resolved N 1s XPS results showed that nitrogen species were not detected at early stages but emerged from ~10 min onward, coinciding with the onset of Ru migration (Supplementary Fig. 19). Collectively, these findings demonstrate that nitrogen-containing intermediates generated during NH3 decomposition not only mobilize ruthenium, but also direct its relocation to the CeO2 domains, thereby promoting the formation of Ru–CeO2 interfaces.
To clarify the nature of nitrogen species, N K-edge soft X-ray absorption measurements were performed. As a reference, N-doped CeO2 was synthesized via urea thermolysis under N2, which is known to have dominant interstitial N species45. Although N-doped CeO2 exhibited a similar N 1s XPS peak to Ru/CeO2-C_NH3, its N K-edge spectrum showed a σ*-dominant feature with negligible π* contribution (Supplementary Fig. 20a). In contrast, Ru/CeO2-C_NH3 showed a markedly different N K-edge spectrum, characterized by a pronounced π* feature at 402.2 eV and a broader, less defined σ* region (Supplementary Fig. 20b)49,50,51. This indicates that, although the N 1s XPS results are similar, the nitrogen species in Ru/CeO2-C_NH3 are not equivalent to interstitial nitrogen, but instead exist in more electronically hybridized environments, likely surface chemisorbed *NH2 on CeO2 domains.
To further examine the evolution of nitrogen species under reaction conditions, the catalyst after 100 h of ammonia decomposition was analyzed. While the N 1s XPS remains centered at 400.1 eV, the N K-edge spectrum showed a clear change, with decreased π* intensity at 402.2 eV and an increased intensity at 399.8 eV (Supplementary Fig. 20c). Although this change primarily occurred within the π* region rather than forming a fully σ*-dominant spectrum, the overall spectral shape shifted toward that of the interstitial-N-dominant reference material. These results suggest that nitrogen species are initially formed as chemisorbed *NH2, but undergo partial evolution toward a more stabilized, lattice-associated interstitial configuration during reaction.
Finally, density functional theory calculations were performed to elucidate the role of nitrogen-containing intermediates in both the mobilization of Ru species and their subsequent stabilization on CeO2 surfaces. The adsorption energies and the energy required to eject a single ruthenium atom from the Ru(0001) surface in the presence of the adsorbed *NH3, *NH2, *NH, and *H species were calculated (Supplementary Fig. 21 and Supplementary Table 3). Among these, *NH2 was the most effective at promoting ruthenium detachment, corresponding to the highest upshift in the ruthenium d-band center. The resulting Ru–NH2 species were then stabilized on both carbon and CeO2 (111) supercells, with adsorption showing a preference for CeO2 over carbon (Supplementary Fig. 22). Also, we constructed models of N-doped CeO2 (111) with nitrogen located at interstitial sites and evaluated their stability. Among the considered configurations, surface interstitial (case 1 in Supplementary Fig. 23a) was found to be the most stable (nitrogen binding energy of −2.45 eV), compared to subsurface configurations. Based on this configuration, the adsorption energies of Ru on pristine CeO2 and N-doped CeO2 surfaces were calculated. The adsorption energy of Ru was significantly enhanced from −4.97 eV on pristine CeO2 to −6.58 eV on N-doped CeO2, indicating a stronger interaction between Ru and the N-doped surface.
To explore the applicability of NH3 treatment beyond ruthenium, Pt/CeO2-C and Rh/CeO2-C catalysts were prepared and treated under conditions that provided comparable NH3 decomposition rates to those of Ru/CeO2-C_N2 (Supplementary Fig. 24a). UHR-TEM and multi-EDS mapping revealed that both platinum and rhodium particles were located near the CeO2 domains (Supplementary Fig. 24b, c). These observations suggest that NH3 treatment facilitates the formation of metal-CeO2 interfaces for ruthenium and for other noble metals.
Hydrogen production by high-pressure NH3 decomposition
Ammonia decomposition at high pressure represents a key step in realizing efficient hydrogen production and storage, yet catalyst stability remains a major challenge under such harsh conditions. Ammonia is a promising hydrogen carrier because of its high hydrogen content, carbon-free composition, and ease of liquefied storage and transport52,53,54. Hydrogen extraction from ammonia typically requires thermal decomposition above 450 °C55,56,57. Especially, high-pressure operation is favored for practical applications. Although ammonia decomposition is thermodynamically favored at low pressure, high-pressure operation is advantageous from a process perspective as it enables direct integration with downstream hydrogen purification systems such as pressure swing adsorption (PSA)58,59,60. In low-pressure systems, an additional compression step is required prior to purification, which is energy-intensive and increases both capital and operational costs61,62. Hydrogen compression from 1 to 10 bar typically requires on the order of ~1 kWh/kgH2, corresponding to a non-negligible energy penalty and additional cost63. Operating the reactor under elevated pressure eliminates the need for recompression, thereby improving overall process efficiency despite a modest thermal penalty associated with slightly higher reaction temperatures.
However, under the harsh reaction conditions of high-pressure NH3 decomposition, catalyst degradation is accelerated, including metal sintering and interfacial breakdown. To overcome these issues, a catalyst capable of maintaining structural integrity under reactive NH3 conditions is required. Our NH3-treated Ru/CeO2-C catalyst may fulfill this criterion, as the high-temperature NH3 treatment drives selective relocation of Ru into atomically dispersed configurations stabilized on CeO2 surfaces. Therefore, this catalyst was employed for high-pressure NH3 decomposition to evaluate its performance and durability.
When ammonia decomposition was monitored under both 1 and 9 bar, Ru/CeO2-C_NH3 exhibited significantly higher activity than Ru/CeO2-C_H2, Ru/CeO2, and Ru/C (Fig. 4a, b). Varying the NH3 pretreatment temperature from 300 to 700 °C revealed that the optimal activity was achieved at 500 °C (Supplementary Fig. 25). Moreover, as compared to previously reported values, the hydrogen production rate achieved using our catalyst under high-pressure conditions highly exceeded those reported for NH3 decomposition at similar pressures (Supplementary Table 4).

NH3 conversion results for a Ru/CeO2-C_NH3, Ru/CeO2-C_H2, b Ru/CeO2, and Ru/C at 1 and 9 bar. c Long-term stability test of Ru/CeO2-C_NH3 and Ru/CeO2-C_H2 for 100 h at 1 and 9 bar. The long-term reaction was conducted at 450 and 500 °C for Ru/CeO2-C_NH3 and Ru/CeO2-C_H2, respectively. NH3 decomposition was conducted using 100% NH3 with a WHSV of 30,000 mL/gcat·h.
To understand the origin of this enhanced performance, kinetic and mechanistic analyses were conducted in both ambient and pressurized conditions, based on the activation energies and reaction orders. The activation energy determined from the Arrhenius plots showed that Ru/CeO2-C_NH3 exhibited a lower activation barrier of 64.0 kJ/mol (1 bar) and 59.9 kJ/mol (9 bar), as compared to 103.9 kJ/mol (1 bar) and 98.8 kJ/mol (9 bar) for Ru/CeO2-C_H2. This indicates that NH3 activation occurred more easily over the Ru/CeO2-C_NH3 (Supplementary Fig. 26a, b). The reaction order was determined by varying the partial pressures of H2 and NH3. The order with respect to NH3 was 0.95 (1 bar) and 0.96 (9 bar) for the Ru/CeO2-C_NH3, 0.91 (1 bar) and 0.94 (9 bar) for the Ru/CeO2-C_H2, suggesting that NH3 activation proceeded through a similar kinetic regime for both catalysts (Supplementary Fig. 26c, d). In contrast, the reaction order with respect to hydrogen was −0.54 (1 bar), and −0.64 (9 bar) for Ru/CeO2-C_H2, −0.23 (1 bar), and −0.32 (9 bar) for Ru/CeO2-C_NH3, confirming that the Ru/CeO2-C_NH3 had less hydrogen poisoning on Ru sites (Supplementary Fig. 26e, f). These results indicate that the selectively formed Ru–CeO2 interfaces via NH3 treatment facilitated efficient NH3 activation while mitigating hydrogen inhibition, thereby accelerating the overall decomposition process. As the differences between ambient and elevated pressures were not pronounced, the consistent activation energy trends and reaction orders confirmed that the intrinsic catalytic behavior is maintained.
The structural stability of the catalysts was assessed through a long-term durability test for 100 h at 1 and 9 bar. Both Ru/CeO2-C_NH3 and Ru/CeO2-C_H2 maintained their initial catalytic activities throughout the reactions without noticeable deactivation, indicating their high operational durability under these reaction conditions (Fig. 4c). In addition, the catalytic performance was maintained over three consecutive reaction cycles under high-pressure conditions (Supplementary Fig. 27). The catalysts were investigated after long-term reaction at high pressure to confirm structure stability. The EXAFS analysis of the Ru/CeO2-C_NH3 after durability test showed that the Ru–O coordination remains high (3.9), while the Ru–Ru coordination remains negligible (0.2), indicating that no significant aggregation of Ru species occurred during reaction. In contrast, the Ru/CeO2-C_H2 after durability test exhibited a substantially higher Ru–Ru coordination (1.4), consistent with the presence of Ru nanoparticles. These results demonstrated that the atomic Ru structure formed after NH3 treatment was preserved even under prolonged high-pressure ammonia decomposition (Supplementary Fig. 28a, b, and Supplementary Table 5). Furthermore, Ru K-edge XANES spectra showed negligible changes before and after reaction, indicating that the oxidation state of Ru was well maintained (Supplementary Fig. 28c). Ru 3p XPS analysis exhibited slight shift to higher binding energy (~0.4 eV), without any evidence of metallic Ru formation, while preserving the relative difference between catalysts (Supplementary Fig. 28d). In addition, Ce 3d XPS and Raman analysis confirmed that the ceria structure and the Ru–CeO2 interaction remain largely unchanged after reaction (Supplementary Fig. 28e–g). XRD results for the Ru/CeO2-C-based catalysts after 100 h of reaction showed that the CeO2 domains did not aggregate or sinter during the operation (Supplementary Fig. 28h). Finally, the UHR-TEM and multi-EDS results confirmed that the ruthenium in Ru/CeO2-C_NH3 remained atomically dispersed on CeO2 domains even after the long-term high-pressure reaction (Supplementary Fig. 29a). In contrast, the ruthenium in Ru/CeO2-C_H2 still existed as nanoparticles randomly distributed across the support without preferential interaction with CeO2 (Supplementary Fig. 29b). This structural conservation suggests that ammonia-driven restructuring occurs primarily before the formation of stabilized Ru nanoparticles. Once strong Ru–Ru bonding and anchoring interactions are established, large-scale redistribution becomes kinetically hindered. Consequently, initial NH3 treatment directed the formation of energetically stabilized and structurally robust Ru–CeO2 interfaces, which preserve atomic dispersion and catalytic performance under high-pressure NH3 decomposition.
Interface-dependent reaction mechanisms for NH3 decomposition
To elucidate the effect of the NH3 treatment-induced structural rearrangement on catalytic performance, the distribution and stabilization of hydrogen and electrons produced during NH3 decomposition were examined. Ruthenium species can reside on both carbon and CeO2, and their distribution depends on the pretreatment conditions. When NH3 decomposes over ruthenium on carbon, the resulting hydrogen and electrons can reduce carbon, leading to methane (CH4) formation with the undesired consumption of electrons and hydrogen. In contrast, when NH3 decomposes over ruthenium on CeO2, hydrogen is effectively trapped and released from the CeO2 support, while electrons are transferred to the carbon support and subsequently supplied to the ruthenium surface when required, thereby increasing the ruthenium electron density.
This behavior was first confirmed by CH4 detection using Fourier-transform infrared spectroscopy with a gas-cell setup. Treating Ru/CeO2-C_N2 with pure NH3 at 500 °C resulted in rapid consumption of NH3 within 10 min, which stabilized for 3 h (Fig. 5a). Simultaneously, CH4 was produced, but diminished quickly and disappeared after approximately 20 min, indicating the rapid rearrangement of ruthenium onto the CeO2 surface. This CH4 formation result was consistent with time-resolved TEM and time-resolved N 1s XPS results (Supplementary Figs. 18 and 19), which showed that Ru migration occurs within a similar time window accompanied by the formation of nitrogen species. The coincidence of methane formation with the Ru migration onset and nitrogen incorporation suggests a strong correlation between these results. In contrast, the H2 treatment at 500 °C on Ru/CeO2-C_N2 exhibited continuous CH4 formation over 3 h with a larger total amount, suggesting the prolonged residence of ruthenium on the carbon support (Fig. 5b, c).

a NH3 consumption for Ru/CeO2-C_N2 monitored using FT-IR gas cells at 500 °C for 3 h. b, c CH4 formation observed using FT-IR gas cells for Ru/CeO2-C_N2 after treatment with 50 % H2/Ar (orange) and 100 % NH3 (blue) at 500 °C for 3 h. d CO2-TPD results of Ru/CeO2-C_NH3 and Ru/CeO2-C_H2 observed using a mass detector. e UPS spectra, f C 1s XPS, and g Ru 3p XPS results for Ru/CeO2-C_NH3 and Ru/CeO2-C_H2. h Schematic diagram illustrating the hydrogen and electron pathways during NH3 decomposition over ruthenium located on the carbon of CeO2.
The formation of basic surface sites due to hydrogen trapping on CeO2 was supported by the results of temperature-programmed desorption using CO2 (CO2-TPD). Ru/CeO2-C_NH3 exhibited a desorption peak that shifted toward higher temperatures with a larger peak signal, indicating enhanced basicity of the surface (Fig. 5d). This agrees with the increase in the Ce3+ and Oads ratios determined using XPS (Supplementary Fig. 15). Also, to directly investigate hydrogen adsorption behavior, temperature-programmed desorption using H2 (H2-TPD) experiments were performed (Supplementary Fig. 30). A low-temperature desorption peak below ~200 °C is attributed to hydrogen desorption from Ru sites, while a broader feature at 300–600 °C corresponds to hydrogen stored on CeO2 via H2-spillover64,65. Notably, Ru/CeO2-C_NH3 exhibited a pronounced high-temperature desorption peak despite hydrogen adsorption at room temperature, indicating efficient hydrogen spillover from Ru to the CeO2 support. This redistribution of hydrogen away from Ru sites reduced hydrogen accumulation and mitigated hydrogen poisoning.
The associated electron transfer and storage on the carbon support were investigated using ultraviolet photoelectron spectroscopy (UPS) and XPS. The UPS results show that Ru/CeO2-C_NH3 exhibited a lower work function (4.69 eV) than Ru/CeO2-C_H2 (4.81 eV), indicating an upward shift in the Fermi level and an increased electron density on the surface (Fig. 5e). The C 1s and Ru 3p XPS spectra of Ru/CeO2-C_NH3 also showed redshifts, confirming electron accumulation on the carbon and ruthenium surfaces (Fig. 5f, g). Supplementary Fig. 31 shows additional C 1s XPS and UPS results for the bare carbon and CeO2-C. These results suggest that during NH3 decomposition of Ru/CeO2-C_NH3, hydrogen atoms generated on Ru migrate to the CeO2 surface, where they are temporarily trapped and then coupled to form H2. Meanwhile, the accompanying electrons are transferred to the carbon support and later supplied back to the Ru sites when needed. Figure 5h schematically illustrates the proposed mechanism. This spatial separation of hydrogen and electron pathways enhances reaction efficiency and suppresses hydrogen poisoning, as evidenced by the reduced hydrogen inhibition observed for Ru/CeO2-C_NH3 (Supplementary Fig. 26).