
(Kitco News) – Gold’s pullback following the hotter-than-expected CPI report this morning is proof that the yellow metal is currently more responsive to U.S. dollar strength and market sentiment than to concrete inflation data, but the technicals still point to a retest of all-time highs, according to Matt Weller, Head of Market Research at StoneX.
“Like most commodities, the pure ‘fundamentals’ for gold – supply and demand – change at a glacial pace,” Weller said. “While it’s certainly true that factors like central bank buying and mining techniques can influence the price of the precious metal over a multi-year horizon, on a day-to-day basis, sentiment toward the precious metal plays a far larger role.”
He wrote that with gold traditionally viewed as a hedge against inflation, “today’s hotter-than-expected US CPI report should be a bullish development,” but this was not the case.
In the current macroeconomic environment, Weller said that today’s higher-than-expected inflation numbers could reinforce the Federal Reserve’s higher-for-longer stance, which would boost the U.S. dollar while making gold less attractive than stocks or bonds. “Trader sentiment has accordingly soured toward the precious metal as a result of these factors, leading to today’s drop to 1-month lows near $2015,” he said.
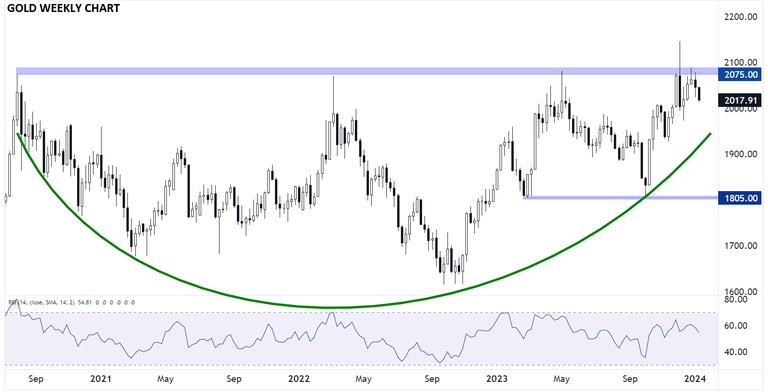
Gold Technical Analysis – XAU/USD Weekly Chart (Source: TradingView, StoneX)
Weller said that despite the short-term selloff, the longer-term technical picture for gold prices remains positive.
“As the weekly chart above shows, Gold has formed a large rounded bottom over the last 3+ years, with clear resistance at the record highs in the $2075 area,” he wrote. “Even a short-term pullback into the mid-$1900s would not invalidate this longer-term bullish setup.”
Turning to the daily chart, Weller said that gold prices are seeing consistent support over the last month on the rising 50-day EMA.
“After a relatively shallow and controlled pullback so far this year, the precious metal is now testing that key support level, hinting at a possible bounce as we head into next week,” he said. “A break above the near-term bearish channel would open the door for a(nother) retest of the key $2075 resistance area.”
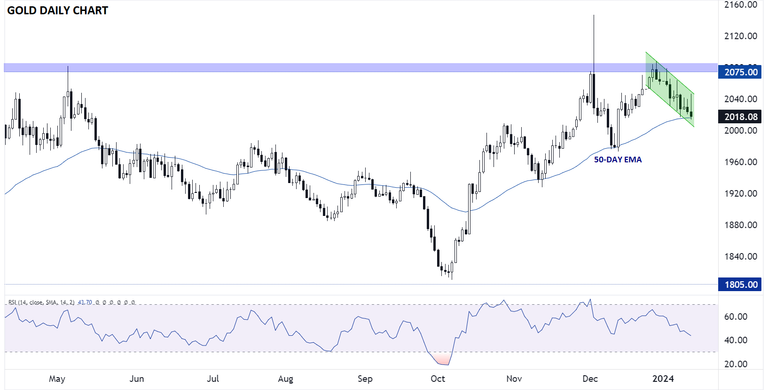
Gold Technical Analysis – XAU/USD Daily Chart (Source: TradingView, StoneX)
“As long as gold continues to put in higher lows on both the daily and weekly charts, pressure will build on its $2075 resistance area, setting the stage for a potentially massive breakout later this year,” he concluded.
Disclaimer: The views expressed in this article are those of the author and may not reflect those of Kitco Metals Inc. The author has made every effort to ensure accuracy of information provided; however, neither Kitco Metals Inc. nor the author can guarantee such accuracy. This article is strictly for informational purposes only. It is not a solicitation to make any exchange in commodities, securities or other financial instruments. Kitco Metals Inc. and the author of this article do not accept culpability for losses and/ or damages arising from the use of this publication.