
Electrocatalytic performance for Re0.06Ru0.94O2
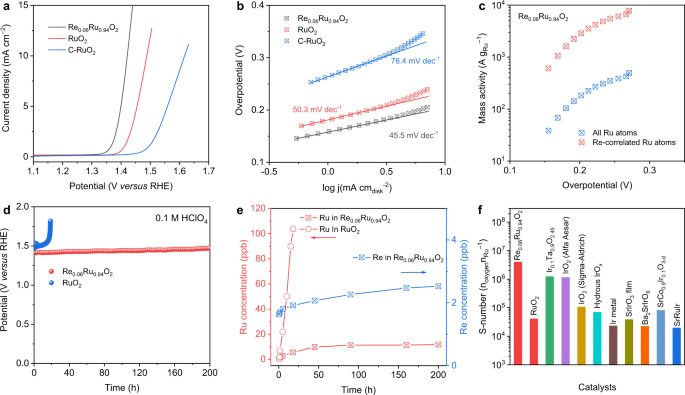
The Re was doped in RuO2 via a molten-salt method, and the chemical formula for Re0.06Ru0.94O2 was determined by inductively coupled plasma mass spectrometry (ICP-MS) (Supplementary Fig. 1). The pristine RuO2 and Re0.06Ru0.94O2 were analyzed by different characterizations (Supplementary Figs. 2–6). OER performances for Re0.06Ru0.94O2 and other control samples were determined in O2-saturated 0.1 M HClO4 electrolyte. Figure 1a, b presents the linear sweep voltammetry (LSV) curves and corresponding Tafel slopes for Re0.06Ru0.94O2, RuO2, and commercial RuO2 (denoted C-RuO2). Re0.06Ru0.94O2 exhibited an overpotential of 190 mV at current density 10 mA cm−2 (η10) with a Tafel slope 45.5 mV dec−1, outperforming RuO2 with 258 mV and 50.3 mV dec−1 and, C-RuO2, 388 mV and 76.4 mV dec−1, respectively38. LSV curves without i-R compensation are presented in Supplementary Fig. 7a as a reference. The mass activity for Re0.06Ru0.94O2 is 500 A g−1 at overpotential 272 mV, which is greater than RuO2 of 156 A g−1 at 272 mV and, C-RuO2 of 18 A g−1 at 290 mV, respectively (Supplementary Fig. 7b). In addition, Re-correlated Ru sites (Ru active sites linked to Re atoms) exhibit a mass activity of 7811 A g−1 (Fig. 1c), which is greater than most acidic OER catalysts. The turnover frequency (TOF)39 for Re0.06Ru0.94O2 at overpotential 272 mV is 0.17 s−1 (Supplementary Fig. 8a), which is an order of magnitude greater than for C-RuO2 of 0.004 s−1. Because recorded current might be affected by the Re and Ru reconstruction, we measured the Faradaic efficiency (FE) for OER by real-time monitoring O2. The Re0.06Ru0.94O2 exhibited a FE of ~100% at current density from 5 to 25 mA cm−2, confirming high OER selectivity (Supplementary Fig. 8b). A comparative performance of Re0.06Ru0.94O2 with reported OER electrocatalysts is presented in Supplementary Table 1. It is seen from the table that Re0.06Ru0.94O2 exhibits comparatively excellent OER performance in acidic electrolytes, better than other recently reported noble metal-based electrocatalysts. The doping impact of Re on OER performance was determined (Supplementary Figs. 9–14) via a series of Re-RuO2 with different Re. It was found that Re doping does not measurably change rutile structure for Re-RuO2.

a LSV curves and b Tafel plot for Re0.06Ru0.94O2, RuO2, and commercial RuO2 in O2-saturated 0.1 M HClO4 (RHE = reversible hydrogen electrode). c Comparison of mass activity for Ru atoms in Re0.06Ru0.94O2 as a function of overpotential. d Constant current chronopotentiometric stability measurements at anodic current density 10 mA cm−2 for Re0.06Ru0.94O2 and RuO2. e Dissolved Ru (left ordinate – y axis) and Re (right ordinate – y axis) ion concentration in electrolyte for Re0.06Ru0.94O2 and RuO2 determined via ICP-MS. f S-number for Re0.06Ru0.94O2 and RuO2 catalyst and Ir-based OER catalysts in acid.
Durability of Re0.06Ru0.94O2 catalyst is an important parameter for acidic OER electrocatalysts40,41. Figure 1d presents the chronopotentiometry data for Re0.06Ru0.94O2 at constant current density 10 mA cm−2 via loading on carbon paper with a loading mass 0.2 mgcata cm−2. It is seen that the potential for Re0.06Ru0.94O2 remained steady (constant) for a continuous 200 h test. However, RuO2 exhibited a rapid activity decay within 19 h, likely the result of Ru dissolution in the acidic electrolyte. Importantly, carbon paper is not an ideal support for acidic OER durability testing because of due substrate passivation42,43,44,45,46. As a result, chronopotentiometry is not always a reliable technique to determine stability of acidic OER catalysts on carbon paper. Detecting catalyst mass losses during OER can provide quantitative information that distinguishes between different degradation mechanisms42. Therefore, Ru dissolution in different catalysts was determined to confirm a degradation mechanism. Figure 1e and Supplementary Table 2 present the time-dependent Ru and Re concentration in the electrolyte, corresponding to Fig. 1d. Dissolved Ru concentration for RuO2 increased rapidly to 104 ppb within 20 h, equaling 2.7% Ru loss. In contrast, dissolved Ru and Re for Re0.06Ru0.94O2 were significantly less at 11.8 and 2.5 ppb after stability testing for 200 h. By converting to mass loss of the metal specie, there was just 0.34% of loss with Ru, and 0.62% with Re. In addition, Ru and Re dissolution rates in Re0.06Ru0.94O2 decreased over time, evidencing a stable structure during OER. The stability number (S-number) for the catalysts was determined via measuring oxygen produced and dissolved metal ion concentration in the electrolyte (Supplementary Fig. 15)40. Both RuO2 and Re0.06Ru0.94O2 show a time-dependent S-number, similar to the recently reported work47. The S-number of the catalysts increases with time, and is attributed to the slower Ru dissolution rate. Significantly, the S-number for Re0.06Ru0.94O2 is significantly greater than that reported for Ru-based electrocatalysts and, importantly, comparable with Ir-based catalysts (Fig. 1f)28,37,40.
Structural evolution of Re0.06Ru0.94O2
The stability of Re0.06Ru0.94O2 was determined via crystal structure and chemical states of samples after 50 h chronopotentiometric test in 0.1 M HClO4. Re single atoms are anchored in the RuO2 crystal without aggregation or reconstruction after OER, as confirmed in the aberration-corrected high-angle annular dark-field scanning transmission electron microscopy (HAADF-TEM) images in Fig. 2a, b, evidencing the stability of Re dopants in the rutile structure during catalyzing. Corresponding elemental mapping confirmed that Re atoms are distributed uniformly in Re0.06Ru0.94O2 nanoparticles, similar to that for the pristine samples (Fig. 2c). Significantly, RuO2 also exhibited a rutile structure after 20 h OER testing (Supplementary Fig. 16), evidencing that degradation of active site does not change crystal structure of the matrix meaningfully. X-ray photoelectron spectroscopy (XPS) and synchrotron-based near-edge X-ray absorption fine structure (NEXAFS) spectroscopy were used to determine the electronic state for Re0.06Ru0.94O2 and RuO2 prior to and after OER testing. As is presented in Supplementary Figs. 5 and 17a, the valence state for Ru in RuO2 after OER increased when compared with that for pristine RuO2, whereas Ru sites in Re0.06Ru0.94O2 were more stable than in RuO2. In addition, the Re sites in Re0.06Ru0.94O2 were highly stable during OER (Supplementary Fig. 17b). O-related spectra for RuO2 evidence higher average Ru valence states and charge redistribution compared with pristine sample, that is caused by Ru dissolution-induced catalyst degradation (Supplementary Figs. 17c, d)48,49.

a, b Aberration-corrected HAADF-STEM image of Re0.06Ru0.94O2 after 50 h OER. Re sites are labeled with yellow-color circles. c EDS mapping images of Re0.06Ru0.94O2 catalyst after 50 h OER. d, e Ru K-edge XANES spectra and FT k2-weighted EXAFS signals for RuO2, Re0.06Ru0.94O2 before and after 50 h OER. f Comparison of Ru K-edge WT-EXAFS for RuO2, Re0.06Ru0.94O2 before and after 50 h OER. g, h Re L3-edge XANES spectra and FT k2-weighted EXAFS signals for Re7+ in aqueous solution, Re0.06Ru0.94O2 before and after 50 h OER. i Comparison of Re L3-edge WT-EXAFS for Re0.06Ru0.94O2 before and after 50 h OER.
Ru K-edge and Re L3-edge XAS prior to and after 50 h OER were characterized to determine the local coordination environment-change of Re0.06Ru0.94O2 after stability testing. Compared with pristine Re0.06Ru0.94O2, the Ru K-edge X-ray absorption near-edge spectroscopy (XANES) of the sample after OER exhibited an (apparently) unchanged valence state with dominated Ru4+ (Fig. 2d), consistent with XPS results. Besides, Fourier-transformed magnitudes of the Ru K-edge extended X-ray absorption fine structure (EXAFS), which exhibited two main peaks at ~1.5 and 3.1 Å, showed slight change in Re0.06Ru0.94O2 (Fig. 2e). They corresponded to the nearest-neighbor Ru−O and next nearest-neighbor Ru−Ru/Re coordination shells, respectively, as confirmed by EXAFS wavelet transformed (WT) analysis which reveals two intensity maxima at ~4.2 and 8.0 Å−1 (Fig. 2f). Further EXAFS fitting showed that the Ru−O peak can be divided into two distinct sub-shells with interatomic distances of 1.92 Å (coordination number N is 1.8) for Ru−O1 and 2.01 Å (coordination number N is 4.1) for Ru−O2, similar to the pristine sample (Supplementary Fig. 18 and Supplementary Table 3). In addition, the apparently unchanged coordination number excludes the formation of highly concentrated Ru/Re vacancies. Therefore the coordination environment for Ru in Re0.06Ru0.94O2 following OER is confirmed to be unchanged, evidencing that Re doping strengthens the Ru−O bond and prevents Ru dissolution. In addition, Re L3-edge XANES confirms that Re0.06Ru0.94O2 after OER exhibits a similar Re valence state (6.33) to the pristine sample (6.38) (Fig. 2g and Supplementary Fig. 19). The Re L3-edge FT-EXAFS spectrum and WT-EXAFS for Re0.06Ru0.94O2 prior to and after OER demonstrate a rather similar profile to the Ru K-edge (Fig. 2h, i), confirming that the Re sites are stable in the RuO2 matrix without formation of ReOx-related species (Supplementary Fig. 20 and Supplementary Table 4). It should be noted that the FT-EXAFS of Ru K-edge and Re L3-edge shows similar shape, confirming the substitutional doping of Re atoms in RuO2.
Dynamic electron transferring in Re0.06Ru0.94O2
Because post-reaction characterizations cannot be used to determine the change in materials during OER, operando Re L3-edge XAS at different overpotentials were carried out to understand the interaction between Re and sites in situ. Changes in the local electronic and atomic structures from open-circuit potential (OCP) to 1.6 V were determined via XANES and EXAFS analysis. As is shown in Fig. 3a–c, the Re dopants in Re0.06Ru0.94O2 exhibit dynamic electron accepting-donating, which, importantly, is different from conventional dopants. Prior to OER, the valence state of Re increased because of Re oxidation with the increase of oxidizing potential. At overpotentials around OER on-site, the Re valence decreased significantly to less than the pristine state. However, at large overpotential, the valence state of Re again increased. This dynamic electron transfer only occurs with applied potential, and is not observed in the post-reaction XAS measurements, Fig. 2. The operando XAS measurement was repeated three times to confirm this unique dynamic electron transfer. Based on the spectral evolution for Re L3-edge, the OER on Re0.06Ru0.94O2 was divided into three stages, (1) pre-catalytic from OCP to 1.35 V, (2) on-site catalytic stage from 1.35 to 1.5 V and, (3) large-overpotential stage from 1.5 to 1.6 V. To determine reaction mechanism in situ the change of Re valence state (Fig. 3d) and the bond length for Re–O1 and Re–O2 (Fig. 3e, Supplementary Fig. 21, and Supplementary Table 4) were analyzed.

a Re L3-edge XANES spectra for Re0.06Ru0.94O2 at differing potentials in O2-saturated 0.1 M HClO4. Right part: contour plot of the Re L3-edge white peak intensity. b FT-EXAFS signals for Re0.06Ru0.94O2 corresponding to (a). c Comparison of Re L3-edge WT-EXAFS plots for Re0.06Ru0.94O2 from OCP to 1.6 V. d Change in Re valence state and OER current as a function of applied potential. e Change in bond length for Re–O1 and Re–O2 coordination shells. The operando XAS measurements were repeated three times to produce the error bar. f Schematic for dynamic electron transfer in Re0.06Ru0.94O2. In OER on-site region, Re dopants gain electrons from neighboring Ru to boost OER. At large overpotential, Re dopants donate electrons back to Ru and prevent dissolution of active sites.
In Stage (1), the average valence state for Re of Re0.06Ru0.94O2 increased from 6.33 to 6.67 when compared with the pristine sample (Fig. 3a, d), while a similar intensity increase was apparent in the first peaks in FT-EXAFS spectra (red-color region, Fig. 3b). In particular, with applied potential increased from OCP to 1.3 V, the Re–O peak shifted positively from 1.36 to 1.38 Å. To determine the reason for these changes, WT analysis of EXAFS spectra was conducted, which provides R- and k-space information and discriminates the backscattering atoms (Fig. 3c). For the contour intensity maximum corresponding to the FT-EXAFS peak for Re–O at 1.36 Å, an evident intensity increase is observed at 9.0 Å−1 (denoted by a dashed line in Fig. 3c), which agrees well with the location of Re–Ru scattering. These changes confirm that this stage is pre-catalytic, in which the increased valence state of Re is due to the oxidizing potential, and not OER reaction.
With an applied potential >1.3 V, Stage (2), the most apparent feature is that the Re valence state decreased significantly from 6.67 to 6.29, as is shown in Fig. 3d. In addition, the bond length for Re–O2 elongates obviously with the increase of applied potentials, evidencing a dynamic electron-transfer amongst Ru, Re and adsorbed oxygen intermediates (Fig. 3e), demonstrating that Re dopants gain electrons from Ru site to tune electronic structure, and activate Ru sites. It is widely acknowledged that the high-valence Ru species are the active sites for OER. Therefore, the Re gains electrons from Ru at Stage (2), to facilitate the formation of high-valence Ru sites to boost OER. This stage also explains why the activity of Re0.06Ru0.94O2 is greater than pure RuO2.
In Stage (3), with the applied potential reaching 1.5 V, the Re valence state increases again from 6.29 to 6.53 (Fig. 3d), evidencing that the Re dopants donate the electrons back to Ru active site. Importantly, WT-EXAFS analysis highlights the appearance of the Ru–Re scattering signal at 1.3 V, and its disappearance at 1.6 V, to demonstrate a dynamic bonding length change between Re–Ru coordination shell, which is associated with a contraction of Re−O2 bond length. This stage evidences that the Re dopants protect the active site from dissolution at large overpotential by donating the electrons back to Ru to maintain stable catalyzing.
We investigated the Ru sites via operando Ru K-edge XAS to determine the change for Ru cations. In contrast to dynamic change for Re cations with applied potential, it was found that both operando Ru K-edge XANES and EXAFS exhibit only ‘slight’ change during catalysis (Supplementary Fig. 22), as was confirmed by detailed Ru K-edge EXAFS fitted analyses (Supplementary Figs. 23–24 and Supplementary Table 3). It is widely acknowledged that XAS analyses reflect average information for all Ru atoms in Re0.06Ru0.94O2. The XAS signal for Ru−O–Ru site dominates and overlaps that for Ru−O–Re site because of the low doping amount of Re in Re0.06Ru0.94O2, leading to the unchanged Ru K-edge spectra. Therefore, we focused mainly on the Re L3-edge to determine the dynamic behavior of Ru−O–Re sites.
Operando XAS results confirm that the electron transfer between Re and Ru site is potential-depended in which the function for Re varies. As is summarized in Fig. 3f, the Re0.06Ru0.94O2 electrocatalyst undergoes a three-step dynamic electron transfer during OER, which is different from conventional RuO2 (Supplementary Fig. 25). At the pre-catalysis stage, the increase in Re valence state is due to the gradually increased oxidizing potential. During OER, Stage (2), the Re atoms gain electrons from Ru site via the O bridge to boost Ru sites for catalyzing, which explains the boosted activity of Re0.06Ru0.94O2. At large overpotentials, Stage (3), the Re dopants donate electrons back to prevent over-oxidation of Ru active sites and formation of H2RuO5 species. Therefore, the stability of Re0.06Ru0.94O2 is significantly boosted to greater than most Ir-based electrocatalysts. Consequently, it is concluded that the Re dopants act as a dynamic electron reservoir that achieves an adaptive tune of the OER active site in situ.
Mechanistic analysis of dynamic electron transfer
The boosted stability of most acidic OER electrocatalysts is from the change in reaction pathway from LOM to AEM28,31,50. This is because the AEM pathway involves multiple intermediates of *OH, *O, and *OOH without lattice oxygen participation, leading to long-term catalyzing51. Therefore, additional in situ measurements were conducted to determine the impact of dynamic electron transfer on the reaction mechanism for Re0.06Ru0.94O2. It is widely acknowledged that conventional RuO2 catalyzes OER in a LOM-involved pathway (Supplementary Fig. 26)16,52 in which the mobilized crystal structure is caused by the oxygen vacancies and leached Ru site. However, the Re0.06Ru0.94O2 exhibited significantly less Ru dissolution than RuO2, most probably because of the changed reaction pathway from LOM to AEM.
We used in situ attenuated total reflectance surface-enhanced infrared absorption spectroscopy (ATR-SEIRAS) to confirm the OER mechanism on Re0.06Ru0.94O2. This is because this technique can examine the potential-dependent surface reaction intermediates. The in situ ATR-SEIRAS spectra for Re0.06Ru0.94O2 at differing working potential (Fig. 4a) exhibit a distinct absorption peak at 1224 cm−1, which is attributed to the O–O stretching of surface-adsorbed *OOH, a typical intermediate for AEM pathway53. Peak intensity increased linearly from OER on-site to 1.6 V, evidencing a constant AEM pathway at different catalyzing stages (Fig. 4b). In comparison, RuO2 exhibits unidentifiable *OOH with weaker intensity after OER on-site (Fig. 4b and Supplementary Fig. 27), confirming a LOM-involved pathway. Noted that an identifiable *OOH peak appeared at an applied potential on RuO2 of 1.6 V (Supplementary Fig. 28), evidencing that a combined LOM-AEM pathway dominates the reaction at large overpotential. In addition, the LSV curves for Re0.06Ru0.94O2 and RuO2 (Supplementary Fig. 29) were carefully analyzed. The RuO2 exhibited an apparent activation-deactivation that agreed well with features of the LOM pathway. In contrast, Re0.06Ru0.94O2 exhibited stable activity under cycling, evidencing a stable AEM characteristic.

a In situ ATR-SEIRAS spectra for Re0.06Ru0.94O2 during multi-potential steps. b Potential dependence of band intensity of characteristic vibration adsorption of surface-adsorbed *OOH. c 34O2 ratio determined via normalization of DEMS signal for Re0.06Ru0.94O2 and RuO2 in 0.05 M H2SO4-H216O. d Illustration for AEM pathway on Re0.06Ru0.94O2 toward acidic OER.
To further confirm the AEM reaction pathway on Re0.06Ru0.94O2 and RuO2, 18O isotope-assisted operando differential electrochemical mass spectrometry (DEMS) analyzes were carried out, which can directly differentiate AEM and LOM. Samples were first labeled using H218O- contained electrolytes (Supplementary Figs. 30–31). In a typical LOM pathway, the lattice oxygen labeled with 18Oads couples with 16O in the electrolyte to generate 34O2. In contrast, the AEM pathway produces 36O2 from water-splitting because no lattice oxygen participates in OER28. As is shown in Fig. 4c and Supplementary Fig. 32, RuO2 produces a clear 34O2 signal with high intensity, significantly greater than that for Re0.06Ru0.94O2. Given that both catalysts exhibit a similar ECSA (Supplementary Fig. 10), the influence of physically adsorbed H218O is excluded. Quantitatively, the RuO2 produces 1.6% 34O2, evidencing a LOM-contained pathway. However, the Re0.06Ru0.94O2 produces just 0.3% 34O2, close to the 18O content in natural water and air, evidencing the AEM pathway (Fig. 4d). Importantly, it was reported that <0.2% of evolved oxygen contains an oxygen atom originating from RuOx11. The difference with our findings is because of poor crystallinity of our sample obtained from the molten salt method, which has more active lattice oxygen. It is concluded that the in situ FTIR, online DEMS and post-reaction XPS measurements confirm the reaction pathway on Re0.06Ru0.94O2 and RuO2. The dynamic Re dopants change the reaction pathway on Re0.06Ru0.94O2 from LOM to AEM, leading to boosted OER.
Computations for activity and stability origin
DFT computations were performed to provide qualitative analyses of the OER mechanism and the stability origin of Re0.06Ru0.94O2. Based on the STEM and X-ray powder diffraction (XRD) findings, a Re-doped rutile RuO2 (110) slab model was constructed. Various doping sites were tested, and the most stable structure was selected. Figure 5a presents the OER with AEM pathway on RuO2 and Re-RuO2 (110), based on in situ measurements. The unsaturated Re site on Re-RuO2 was inactive for OER because of the too strong adsorption of key oxygen intermediates (Supplementary Fig. 33). Reaction intermediate configurations on Re-RuO2 (110) are illustrated in Fig. 5b (Those for RuO2 are shown in Supplementary Fig. 34). The initial step is the formation of a deoxygenated surface (A1), followed by adsorption of a water molecule on the Ru site (A2) together with subsequent formation of OH* (A3) and O* (A4) species from H2O* deprotonation. Then, the adsorption of another water molecule occurs to compose an OOH* (A5). It should be noted that this step is unstable, in which the OOH* donates the proton to the neighboring oxygen to form an H-stabilized OO* species (A6). Molecular oxygen is then formed from this H-stabilized OO* (A7)52. As is shown in Fig. 5a, the step from A4 to A5 is the most energetically difficult step under 1.23 VDFT-RHE (defined by a computational hydrogen electrode model)54, where Re-RuO2 exhibits reaction energy of 0.79 eV, 0.1 eV less than that on RuO2. Thermodynamic advantage of Re-doped RuO2 over pure RuO2 is therefore demonstrated. In addition to LOM and AEM pathways, a new oxide path mechanism (OPM) pathway has been confirmed that allows direct O–O radical coupling without generation of oxygen vacancy defects and extra reaction intermediates (Supplementary Fig. 35)55,56. Therefore, Fig. 5c compares the minimum required energy to activate AEM, LOM, and OPM pathways on, respectively, Re0.06Ru0.94O2 and RuO2. The AEM pathway is seen in the figure to be the most energetically favorable compared with the other two on both surfaces, evidencing that it dominates OER under the equilibrium potential. Qualitative analyses of OER mechanism for RuO2 and Re-RuO2 with metal vacancies were assessed via DFT computation. Importantly, the structure for Re-RuO2 with a Re vacancy is the same as for RuO2 with a Ru vacancy following stabilization. We considered Re (vac-RuO2) and Ru (vac-Re-RuO2) vacancies therefore on Re-RuO2 to determine the impact on electrocatalytic performance. As is seen in Supplementary Figs. 36 and 37, although the sample with metal defects exhibits optimized OPM thermodynamic energy, it is less than that for AEM on Re-RuO2, confirming the advantage of Re-RuO2 over RuO2 or metal defects.

a, b Free energy diagram for OER on unsaturated Ru site of Re0.06Ru0.94O2 and RuO2 at 1.23 V versus RHE, showing six (6) possible intermediates for the (110) surfaces. Dashed lines indicate unstable –OOH precursor states, shown as H-stabilized OO*. c Minimum activation energy for different reaction pathways for Re0.06Ru0.94O2 and RuO2. d Oxidation state for RuO2 and Re0.06Ru0.94O2 described by differences in electron transfer based on Bader charge computations. Black-color arrows show direction of electron transfer.
Although the in situ measurements appear to evidence that OER on RuO2 is likely to occur through a combined LOM-AEM pathway, we hypothesize that the LOM pathway on RuO2 is activated because of the applied potential and corrosive acidic environment that mobilizes the Ru–O bond and leads to the generation of O vacancies. This greater tendency for the AEM pathway with Re-RuO2 and stability origin was examined via surface oxidation states. As is seen from Bader charge analysis (Fig. 5d), more negative charge is transferred from Re to Ru via the O bridge on the Re-RuO2 surface compared with RuO2, confirming that Re doping reinforces the stability of Ru–O bond, and promotes the AEM under acidic media. An acknowledged drawback, however, is that DFT computations cannot simulate the dynamic electron transfer because the bond length and electronic structure differ with applied potential change. However, the DFT does provide a reasoned, qualitative evaluation of Re0.06Ru0.94O2 that is important to establish the activity and stability origin of the catalysts.