
Ask which metal is the rarest and most answers land on francium. That answer is technically correct and practically useless. Fewer than 1 kg of it exists in the planet’s crust at any moment, and nobody can buy it, store it or put it to work.
The scarce metals that move industrial supply chains and investor portfolios are different ones. They are stable, tradable and tied to real demand. They are also produced in volumes so small that a single disrupted mine or a new technology can tip their markets.
“Rare” covers two different ideas. Some elements decay away almost as soon as they form, while others are stable but scattered so thinly that only by-product recovery makes them economic. For you as an investor, rarity only counts when it meets genuine demand. The figures here come mainly from the USGS Mineral Commodity Summaries 2026 and market reports from Johnson Matthey, Heraeus and Metals Focus.
You will come away knowing which stable metals are genuinely scarce, why supply cannot respond quickly to a higher price, and what drives each market.
What does “rarest metal” actually mean?
Start with the trivia answer, because it shows you why trivia is a poor guide.
Francium in numbers Fewer than 1 kg of francium is estimated to exist in the crust at any moment. Its half-life (the time it takes for half of a sample to decay) is just 22 minutes.
Francium is a radioactive alkali metal. It can be made by striking radium with neutrons or thorium with protons, but it disappears too quickly to have any use outside a laboratory. Astatine, often called the rarest naturally occurring element, is scarcer still: under 50 mg is estimated to sit in the top kilometre of crust. It is a halogen, not a metal, and serves only research.
Both share one trait. Neither has a commercial market, so neither matters to your portfolio.
The useful distinction is between two kinds of rarity:
The stable group is where the real story sits. The USGS lists the rarest crustal metals as the six platinum group elements plus gold, rhenium and tellurium (which it classes as a metalloid, an element with properties between metals and non-metals). Rhenium averages about 0.001 ppm (parts per million) and gold 0.0013 ppm, while rhodium and iridium sit in the parts-per-billion range.
On annual output, the Royal Society of Chemistry identifies rhodium as the scarcest non-radioactive metal, with iridium close behind. That is your working answer.
The Royal Society of Chemistry also treats rhodium as the rarest of all non-radioactive metals, a ranking that rests on how little of it is mined each year rather than on how thinly it sits in the crust.
The lesson for you: crustal rarity alone tells you little. Scarcity becomes investable only when it collides with industrial demand and a market where the metal actually trades.
When big ASX news breaks, our subscribers know first
Why can’t miners simply produce more of these metals?
If rhodium is so valuable, why does nobody open more rhodium mines? Because rhodium mines, in the sense you might imagine, do not exist.
Rhodium, iridium and ruthenium: riding on platinum and palladium
These metals are scarce for two stacked reasons. First, they are present at parts per billion. Second, they are by-products, meaning they are recovered as a side stream while miners extract something else, mainly platinum and palladium (and, for iridium and ruthenium, nickel refining).
That makes the decision to dig someone else’s call. Here is how a price spike plays out:
- The price rises. Rhodium or iridium becomes far more valuable.
- Miners look at the primary metals. Whether to expand a large mine depends on platinum and palladium economics, not rhodium’s price.
- Expansion is costly. A producer would need to process much more ore from a large polymetallic operation and accept exposure to the primary metals.
- Ore output barely moves. Only recycling, inventory release and better recovery rates can respond quickly.
Geography tightens the squeeze. South Africa dominates supply and contends with deep-level mining costs, electricity interruptions, declining grades and operational disruptions. According to the USGS, South African PGM-containing mined material fell an estimated 9% in 2025, and Russian output, which carries its own geopolitical risk, also fell.
Because rhodium, iridium and ruthenium follow the primary metals, the platinum and palladium thesis matters for you: the two metals now diverge, and that split shapes the by-product supply of everything else.
Rhenium: a by-product of copper and molybdenum
Rhenium is the extreme case. It is recovered mainly from molybdenite concentrates (the processed ore of molybdenum) during copper-molybdenum processing, so there is no such thing as a “rhenium mine”. Its supply depends on five links:
- copper and molybdenum mine output
- the rhenium content of the ore
- whether the processing plant captures the metal
- refinery capacity
- the economics of recovery from lower-grade concentrates
Gold sits at the other end. It occurs in native form, trades in deep markets and responds to investment flows rather than narrow industrial supply.
For you, this is the core insight. When one of the minor metals spikes, do not expect new supply to cap it quickly. That is why moves can be sharp and prolonged.
How much of each metal is produced, and what is it used for?
The scale gap becomes obvious once the numbers sit side by side. All figures below are USGS estimates for 2025; PGM numbers are estimates because the metals come from polymetallic ores, and rhenium measures recovered output.

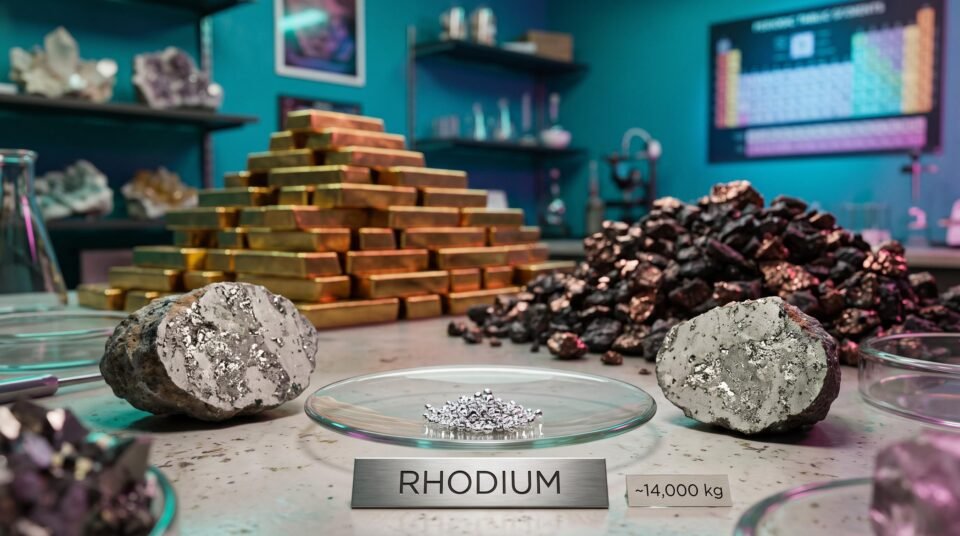
While gold output runs to 3,300 tonnes, scarce metals like iridium and rhodium yield only ~2,200 kg and ~14,000 kg respectively in 2025.
Older sources cited roughly 30 tonnes of rhodium and 3 tonnes of iridium a year. Treat those as rounder, earlier estimates; the 2026 data are lower.
Iridium’s entire annual output would fit in a small van. Gold’s runs to thousands of tonnes.
End uses
Rhodium is a one-application metal. About 84-85% of demand comes from automotive catalysts, which cut nitrogen oxides in exhaust, according to the International Platinum Group Metals Association and Johnson Matthey-based figures. The often-quoted 80% is directionally right but understated; chemical catalysis takes about 9% and glass about 4%.
Iridium and ruthenium spread more widely:
- Iridium (2024): electronics 32%, chemical 32%, electrochemical 17%, automotive 4%, other 14%
- Ruthenium (2025, Johnson Matthey, 1.224 million oz): chemical about 47%, electronics about 30%, electrochemical about 11%, other about 12%

Rhodium relies heavily on automotive catalysts for 84-85% of demand, whereas iridium and ruthenium have more diversified end uses.
Rhenium goes mostly into nickel superalloys for single-crystal turbine blades, so its demand tracks aerospace engine production.
The takeaway for you: in a tonne-scale market, one application can tip the balance. The end-use mix tells you which technology trend to watch for each metal.
What do prices and market balances say about scarcity right now?
Scarcity is not a fixed state. Rhodium’s recent history shows it working as a cycle, with inventories often deciding the outcome faster than mines.
- 2021: Rhodium hit a record of about US$29,890/oz after strong automotive demand and production disruptions.
- 2023: Chinese glass makers liquidated stockpiles, pushing prices sharply lower.
- 2025: Weaker South African supply renewed deficit concerns. Metals Focus estimated a deficit of about 74,000 oz, down from 143,000 oz in 2024.
- 2026 outlook: Heraeus, in its forecast published on 9 November 2026, said rhodium could shift from a small deficit into surplus as combustion-engine output falls and recycling rises.
Here is where each metal sits. Be careful comparing rows: annual averages, spot quotes and specialist assessments measure different things, and the minor-metal figures are estimates from the named sources.
The other metals show how specific technologies create tightness. Rhenium’s ammonium perrhenate (APR, a chemical form used in catalysts) rose 78% and its pellets 90% on 2024 averages. Johnson Matthey linked ruthenium’s stronger demand to hard disks for data centres, and iridium’s strategic profile rests on hydrogen.
The Johnson Matthey PGM report is the main source for how platinum, palladium and rhodium balances are measured, and it shows why a deficit in one metal can sit beside a surplus in another within the same ore stream.
Heraeus’s 2026 ranges put rhodium at US$6,000-9,000/oz, iridium at US$3,800-5,150/oz and ruthenium at US$600-975/oz. Past performance does not guarantee future results, and projections like these depend on market conditions and other risk factors.
What this tells you: a deficit measured in ounces can matter more than its size suggests, but stockpiles being drained or rebuilt can swing these markets well before any mine does.
What should investors weigh before treating scarcity as an opportunity?
Scarcity does not guarantee a return. It does not even guarantee you can buy the metal at a fair price.
Reuters has described rhodium as thinly traded and highly volatile, and the 2021-2023 round trip proves the point. Weigh these risks before you treat any minor metal as an opportunity:
- Thin markets: one producer, consumer or investor changing position can move prices sharply
- Physical access: specialised bars exist, but supply is limited, premiums are high and bid-ask spreads (the gap between buying and selling prices) are wide, so selling can be harder than buying
- Supply concentration: a South African disruption can hit several metals at once, and Russia adds sanctions risk
- Slow recycling: recovery from spent catalytic converters depends on scrappage rates, collection, processing capacity and when vehicles are retired, so it buffers shortages slowly
Price data are not comparable Gold trades on a deep, transparent spot market. Rhenium is quoted through producer or specialist prices, and rhodium, iridium and ruthenium through specialist assessments. Annual averages, spot quotes and producer prices are not interchangeable.
Demand-transition risk: rhodium and iridium pull in opposite directions
Rhodium’s 84-85% automotive exposure is its weak point. Battery-electric vehicles need no exhaust catalyst, and platinum or palladium can substitute in some formulations. Offsets exist: stricter emissions rules, hybrids that still burn fuel and higher loadings per vehicle can slow the decline.
Iridium faces the reverse. With only about 2.2 tonnes a year of supply, large-scale PEM electrolyser build-out could strain the market badly. Yet thrifting (using less metal per unit) and alternative catalysts could cut demand, and Heraeus expects recovering South African supply and a cautious hydrogen pipeline to limit price gains.
Thrifting is already moving from theory to lab results, and nanotechnology iridium reductions of up to 75% in electrolyser catalysts show how quickly demand assumptions for this tiny market could change.
Gold behaves differently again, driven by investment, central banks and macroeconomic forces. The point for you: scarcity is necessary but not sufficient. The demand path and your access to the market decide whether it is investable.
Reading scarcity correctly: what the rarest stable metals tell you
The ranking now holds together. Rhodium is the scarcest commercially important stable metal, while iridium is nearly as scarce and arguably more strategically exposed. Ruthenium and rhenium tighten through specific channels such as data storage and turbines, and gold is abundant, liquid and investment-driven. Francium and astatine win the trivia contest but have no market.
If you follow these metals, four variables will shape what happens next:
- South African PGM output
- EV and hybrid adoption rates
- Hydrogen electrolyser deployment
- Recycling volumes and inventory levels
Each one can shift a tonne-scale market faster than any new mine. Watching them gives you a clearer read on where scarcity is building, and where it may be about to ease.
These statements are speculative and subject to change based on market developments.
This article is for informational purposes only and should not be considered financial advice. Investors should conduct their own research and consult with financial professionals before making investment decisions.