
Some scholars have put forth that India’s GDP growth rate was overestimated in the old national accounts series with base year 2011-12 – due to methodological issues including the use of the organised sector as proxy for the unorganised sector, and use of wholesale price index as a deflator for certain services. In this post, Goldar refutes these arguments, and concludes that there was likely no significant overestimation.
In the 10-odd years since the release of India’s national accounts series with base year 2011-12 (hereafter NAS-2011/12 series) in 2015, it has been subjected to scrutiny and criticism, and there has been much debate over the reliability of the estimated GDP (gross domestic product) growth rates. In this post, I examine two issues raised by some scholars regarding the reliability of GDP growth in the NAS-2011/12 series and the claim that GDP growth has been overestimated. One relates to estimating GVA (gross value added) for the unorganised sector, or, more specifically, the GVA estimate for the household sector (total industry minus the corporate and quasi-corporate sectors), using proxies based on organised-sector growth. The second issue pertains to the use of WPI (wholesale price index), which represents prices of goods, instead of CPI (consumer price index) for certain services sector industries.
Sengupta and Paramanik (2026) note that the assumption implicit in certain applied methods in the NAS-2011/12 series that unorganised-sector activity evolves in a manner similar to the organised sector broke down during major shocks such as demonetisation in 2016, the implementation of GST (goods and services tax) in 2017, and the Covid-19 pandemic. Therefore, using proxies for organised-sector growth to estimate unorganised-sector GVA will lead to an overestimation of GDP growth. They also raise a similar concern about the deflators used for services. They point out that WPI is heavily weighted toward commodities such as oil and metals and does not track the prices of services. Hence, using a commodity-heavy index to deflate any part of the service-sector growth creates a mismatch, suggesting a possible overestimation of GDP growth.
Using organised-sector proxy to measure informal-sector growth
While raising a concern about the use of organised-sector growth as a proxy for assessing growth of the unorganised/household sector, some scholars have emphasised that the unorganised/household sector constitutes about 45% of the Indian economy. The implication is that, due to its large relative size, errors in the estimation of GVA growth in the informal sector will have a significant impact on the estimated growth rate for the entire economy. There is a flaw in this argument. Agriculture and allied activities formed about 18% of India’s aggregate GVA and about 40% of the total GVA of the household sector of the Indian economy in 2023-24 (at current prices), and it should be noted that in obtaining the GVA estimate of the household segment of this sector in the NAS-2011/12 series, no organised-sector proxy was used. A similar argument may be made for the construction sector – the GVA of its household segment was not estimated using the growth rate of the organised segment (Ramana Murthy 2019, Anant 2025). The share of construction in aggregate GVA of the Indian economy was about 9% in 2023-24, and it accounted for about 16% of the GVA of the household sector. Thus, the assertion that the GVA estimate for informal-sector enterprises was driven by a proxy for organised-sector growth, leading to misestimation, does not hold for more than half of the informal economy. Actually, this does not hold for a much larger portion of the Indian economy, as the ensuing discussion will show.
In the NAS-2011/12 series, GVA for the household segment of the road transport industry, ownership of dwellings, education and health services, and several personal services (referred to here as ‘miscellaneous services’) was not derived using a proxy for organised-sector growth (Ramana Murthy 2019, Goldar 2026a). In (a) financial services and (b) public administration and defence, the GVA of the household sector is zero. Thus, the issue of using organised-sector proxies to estimate the GVA of the household sector is not relevant. Only in a small part of the informal economy were organised-sector proxies used in the NAS-2011/12 series.
Figure 1 shows the industry-wise breakdown of real GVA in the Indian economy for the years 2011-12 to 2023-24, according to the NAS-2011/12 series. The industries in which the GVA estimation of the household sector was based on corporate-sector growth, organised-sector growth, or the growth in sales tax/GST (organised-sector proxy) are called ‘other industries’ in the figure and shown at the top of the chart, separately for the corporate and household segments. The portion of the informal economy for which GVA was estimated using an organised-sector proxy accounted for only about 10% of the Indian economy’s aggregate GVA.
Figure 1. Gross value added at 2011-12 prices, different sectors of the Indian economy
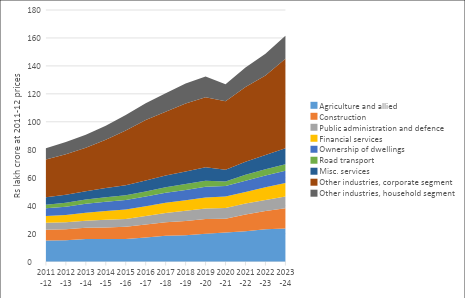
Source: Author’s computations using data from National Accounts Statistics, 2025.
Between 2011-12 and 2023-24, the annual compound growth rate in deflated aggregate GVA was about 5.9%. Between 2015-16 and 2023-24, the deflated GVA of the household segment of ‘other industries’ increased by about Rs 5.3 lakh crore (at 2011-12 prices). In view of the argument noted above about the effects of demonetisation, introduction of GST, and Covid-19, one may assume that the actual increase was not Rs 5.3 lakh crore, but only half of that, that is, Rs 2.7 lakh crore. With this downward adjustment, the annual compound growth rate of the Indian economy’s aggregate real GVA between 2011-12 and 2023-24 is estimated at about 5.8% per year, that is, a reduction of only about 10 basis points. Under an extreme assumption that real GVA in the household segment of ‘other industries’ did not grow at all between 2015-16 and 2023-24, the growth rate of the Indian economy’s aggregate real GVA is found to be 5.6% per annum, about 30 basis points lower. Evidently, the impact of using organised-sector proxies for informal-sector GVA estimation, which has been claimed to have led to an overestimation of GDP growth, was low or negligible.
Comparison with the new GDP data
Additional insight into the issue under investigation may be obtained by comparing GVA estimates for the household segment in the new national accounts series with those in the previous series (NAS-2011-12). The recently released new national accounts data with the base year 2022-23 (Press Note on New Series of GDP Estimates with Base Year 2022-23) permits comparison with a fresh estimate of the household sector’s GVA for 2022-23 and 2023-24. Figure 2 compares current price GVA in the household sector of the economy, excluding agriculture and allied activities, as organised-sector proxies were not used (and are not) for GVA estimation in this sector. There is only a small difference between the GVA estimates from the two national accounts series for 2022-23, and none for 2023-24. This finding provides further support to the assertion above that the application of organised-sector proxies for GVA estimation of certain segments of the unorganised sector in the non-farm economy in the NAS-2011-12 series did not lead to any significant overestimation of India’s GDP growth rate.
Figure 2. Gross value added of household sector excluding agriculture and allied activities, at current prices
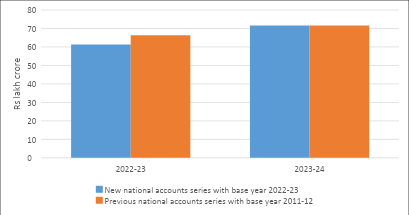
Source: Author’s computations using National Accounts Statistics, 2025, and Press Note for the new national accounts series (dated 27 February 2026).
Note: The corporate segment of agriculture and allied activities accounts for a small share of this sector. This information is not available for the new national accounts series. Hence, the relevant proportion has been computed using the previous national accounts data and applied to the new national accounts data.
Using WPI as a deflator for certain services
Since the application of WPI to service industries has been claimed to have caused a significant overestimation of India’s GDP growth, the issue is investigated next. One may ask: how much difference to India’s estimated aggregate real GVA growth rate would have been made if the CPI had been applied to the services sector industries rather than a deflator based on the price index of goods, in those cases where the latter was used?
In some service sector industries (for example, public administration and defence), deflation was done by using the CPI in the NAS-2011/12 series; therefore, the abovementioned issue regarding the use of WPI rather than CPI does not apply, and no adjustment is required. In several other service industries (for example, transport, communication, and personal services), volume extrapolation or a combination of volume extrapolation and GVA deflation using the CPI was undertaken. Again, no adjustment is needed. In some industries, a WPI-based index was used for deflation, but this is not a problem because there is a strong case for using such an index (for example, trade and repair services) (for details, see Goldar 2026b).
Figure 3 shows the real GVA of five segments of the Indian economy. Separate series (areas in the chart) are shown for (i) Goods producing sectors (agriculture and allied, manufacturing, mining and querying), (ii) Electricity, gas, water supply and other utility services, (iii) Trade and repair services, and (iv) a group of services that include public administration and defence, construction, transport, communication, ownership of dwellings and miscellaneous services where the CPI was used for deflation or the method of volume extrapolation was used. The remaining services form the fifth segment and are shown at the top of the chart. The methodological issue regarding deflators mentioned at the beginning of this post, which raises the question of misestimation of GDP growth due to the use of WPI, applies only to these industries. In 2011-12, these industries accounted for about 13% of aggregate economy GVA.
Figure 3. Gross value added at 2011-12 prices, five segments of the Indian economy
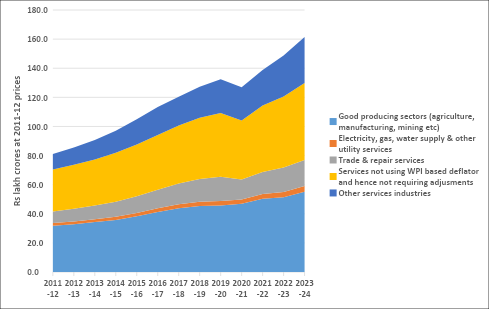
Source: Author’s computations based on National Accounts Statistics, 2025.
If WPI is not used and instead the nominal GVA of ‘other services industries’ is deflated by the CPI general (rural and urban combined), and the real GVA of these industries so obtained is used instead for the estimate available in NAS, 2025, then the deflated GVA of these industries for 2023-24 comes down by about Rs. 6.1 lakh crores, and the annual compound growth rate in aggregate economy real GVA growth is found to be 5.6% (instead of 5.9%), indicating a required downward adjustment of about 30 basis points. The adjustment indicated by the analysis is small, and the actual adjustment required would be still lower for the following two reasons which caused underestimation of aggregate GVA growth: (a) WPI for computer equipment, communication equipment and consumer electronics in India does not adequately reflect the rapid and significant product quality improvement that has taken place (Goldar 2026b), and thus manufacturing sector growth was under-estimated, (b) the use of CPI for telecommunications for deflating GVA has caused significant underestimation of GVA growth of this industry (Goldar 2026b). The overestimation of annual GDP growth by 30 basis points due to the use of ‘inappropriate’ deflators, assessed above, will be substantially or fully neutralised by the underestimation of GDP growth caused by the two factors above. Thus, in the net, there was perhaps no overestimation of GDP growth.
Conclusion
In the national accounts series with base 2011-12, proxies for organised-sector growth were used to estimate the GVA of the unorganised sector in some industries only (accounting for only about 10% of the aggregate Indian economy), not all. The argument that, due to the effects of demonetisation, introduction of GST, and Covid-19 pandemic, the use of organised-sector proxies for estimating the GVA of the informal sector resulted in a significant overestimation of GDP growth rate does not seem to have much validity in view of the evidence presented in this post. The extent of overestimation of GDP growth due to this methodological issue was relatively small. The same holds for the concern raised about using WPI instead of CPI for certain service-sector industries. While the use of WPI may have caused some overestimation of GDP growth, this was counterbalanced by underestimation of GDP growth due to certain deflators (for computer equipment, communication equipment and consumer electronics, and telecommunications services). In the net, there was perhaps no overestimation of GDP growth.
The views expressed in this post are solely those of the author, and do not necessarily reflect those of the I4I Editorial Board.
Further Reading
- Anand, A, Felman, J and Subramanian, A (2026), ‘India’s 20 Years of GDP Misestimation: New Evidence’, Peterson Institute for International Economics, Working Paper No. 26-3.
- Anant, TCA (2025), ‘India’s informal sector isn’t off the map: It’s being tracked better than ever’, Mint, 19 June.
- Goldar, B (2026a), ‘India’s GDP Growth during 2011-2022 Not Overestimated: Examining the Issue of Correctly Measuring Unorganised Sector GVA Growth’, ResearchGate.
- Goldar, B (2026b), ‘India’s GDP Growth during 2011-2022 Not Overestimated: Examining the Issue of the Right Deflators for the Services Sector GVA’, ResearchGate.
- Ramana Murthy, SV (2019), ‘Measuring Informal Economy in India: Indian Experience’, IMF Seventh Statistical Forum.
- Nagaraj, Radhika, Amey Sapre and Rajeswari Sengupta (2020), “Four Years After the Base-Year Revision: Taking Stock of the Debate Surrounding India’s National Accounts Estimates”, India Policy Forum, 16(1): 55-107.
- Sengupta, R (2016), ‘GDP conundrum: Is India booming?’, Ideas for India, 16 November.
- Sengupta, R and Paramanik, S (2026), ‘India’s GDP makeover: What is changing?’, Ideas for India, 05 January.