

-
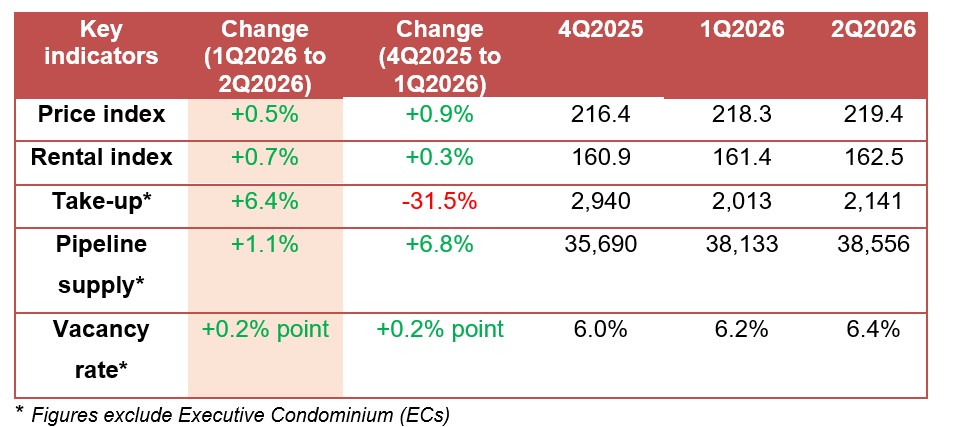
The overall private residential price index increased by 0.5% in 2nd Quarter 2026, lower than the 0.9% increase in the previous quarter. This brought the cumulative increase for the first half of 2026 to 1.4%, below the 1.8% gain in the first half of 2025.
-
To meet housing demand and maintain market stability, the Government is sustaining a high and steady supply of private housing through the Government Land Sales (GLS) Programme. 4,745 private residential units will be launched under the Confirmed List for the second half of 2026, bringing the full-year Confirmed List supply to 9,320 units, over 50% higher than the annual average over the past 10 years. In total, about 60,600 private residential units (including ECs) are expected to be completed over the next few years.
-
The macroeconomic outlook remains highly uncertain. Households are advised to exercise prudence when purchasing property and taking out mortgage loans.
1 The Urban Redevelopment Authority (URA) released today the real estate statistics for 2nd Quarter 2026.
PRIVATE RESIDENTIAL PROPERTIES
Overview:
Prices and Rentals
2 Prices of private residential properties increased by 0.5% in 2nd Quarter 2026, compared with the 0.9% increase in the previous quarter.
Property Price Index of private residential properties
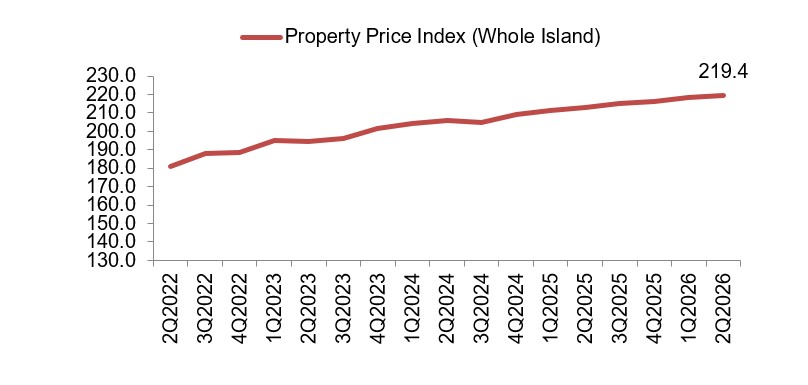
3 Prices of landed properties increased by 2.5% in 2nd Quarter 2026, compared with the 0.4% decrease in the previous quarter. Prices of non-landed properties decreased by 0.1% in 2nd Quarter 2026, compared with the 1.3% increase in the previous quarter.
4 Prices of non-landed properties in Core Central Region (CCR) increased by 1.8% in 2nd Quarter 2026, compared with the 0.6% increase in the previous quarter. Prices of non-landed properties in Rest of Central Region (RCR) decreased by 1.2% in 2nd Quarter 2026, compared with the 0.8% increase in the previous quarter. Prices of non-landed properties in Outside Central Region (OCR) decreased by 0.1% in 2nd Quarter 2026, compared with the 2.2% increase in the previous quarter (see Annex A-1).
5 Rentals of private residential properties increased by 0.7% in 2nd Quarter 2026, compared with the 0.3% increase in the previous quarter.
Rental Index of private residential properties
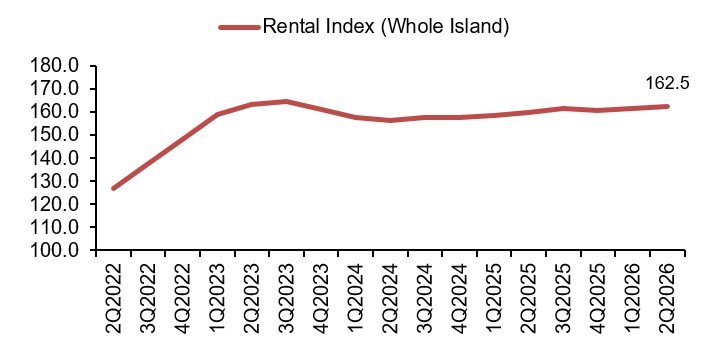
6 Rentals of non-landed properties increased by 0.4% in 2nd Quarter 2026, same as that in the previous quarter. Rentals of landed properties increased by 2.7% in 2nd Quarter 2026, compared with the 0.1% increase in the previous quarter.
7 Rentals of non-landed properties in CCR properties increased by 1.2% in 2nd Quarter 2026, compared with the 0.5% increase in the previous quarter. Rentals of non-landed properties in RCR remain unchanged in 2nd Quarter 2026, compared with the 0.2% decrease in the previous quarter. Rentals of non-landed properties in OCR decreased by 0.3% in 2nd Quarter 2026, compared with the 1.0% increase in the previous quarter (see Annex A-2).
Launches and Take-up
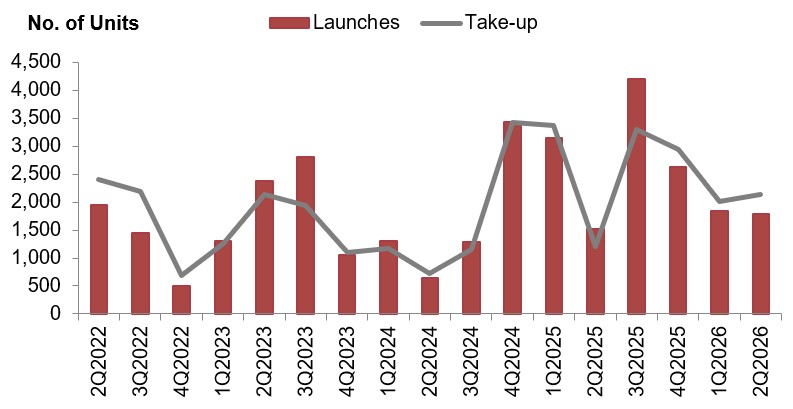
8 Developers launched 1,783 uncompleted private residential units (excluding ECs) for sale in 2nd Quarter 2026, compared with the 1,844 units in the previous quarter (see Annex C).
9 Developers sold 2,141 private residential units (excluding ECs) in 2nd Quarter 2026, compared with the 2,013 units sold in the previous quarter (see Annex D).
Number of private residential units launched and sold by developers (excluding ECs)
10 Developers did not launch any EC units for sale in 2nd Quarter 2026 and sold 175 EC units in the quarter (see Annex F). In comparison, developers launched 1,320 EC units for sale and sold 1,168 EC units in the previous quarter.
Resales and Sub-sales
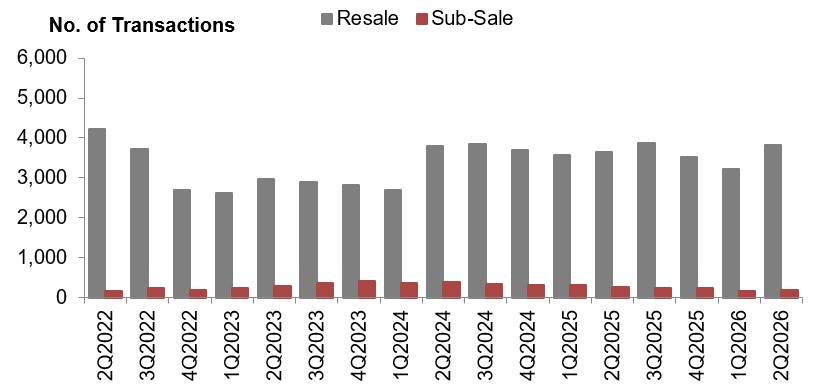
11 There were 3,813 resale transactions in 2nd Quarter 2026, compared with the 3,225 units transacted in the previous quarter. Resale transactions accounted for 62.0% of all sale transactions in 2nd Quarter 2026, compared with 59.6% in the previous quarter (see Annex D).
12 There were 194 sub-sale transactions in 2nd Quarter 2026, compared with the 175 units transacted in the previous quarter. Sub-sales accounted for 3.2% of all sale transactions in 2nd Quarter 2026, same as that in the previous quarter (see Annex D).
Number of resale and sub-sale transactions for private residential units (excluding ECs)
Supply Completions
13 A total of 1,212 private residential units (including ECs) were completed in 2nd Quarter 2026 (see Annex E-4).
Supply in the Pipeline
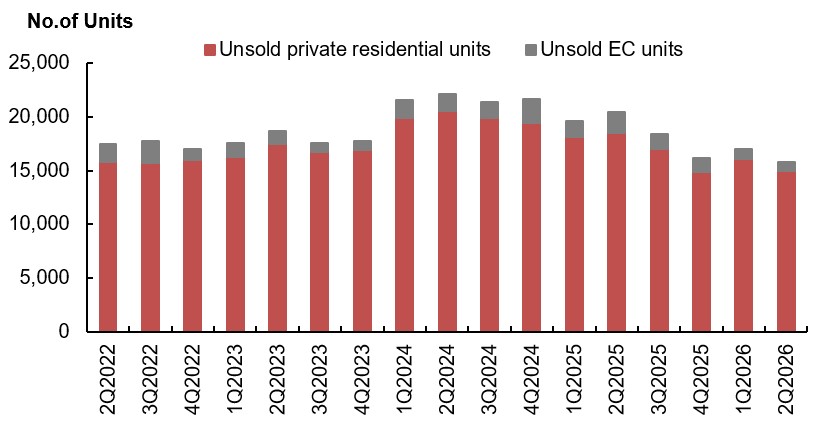
14 As at the end of 2nd Quarter 2026, there were 42,472 units (including ECs) in the supply pipeline with planning approval, of which 15,810 units remained unsold (see Annexes B & E-1). In addition, there were 18,153 unsold units (including ECs) that have not been granted planning approval yet, including 4,745 units on the Confirmed List of the GLS Programme for 2H2026 (see Annex E-3).
Total number of unsold private residential units with planning approval in the pipeline
15 Based on the expected completion dates reported by developers, about 60,600 private residential units are expected to be completed in the coming years. These comprise about 25,900 units (including ECs) expected to be completed by 2028, and about 34,700 units expected to be completed from 2029 onwards (see Annex E-3).
Pipeline supply of private residential units and ECs by expected year of completion
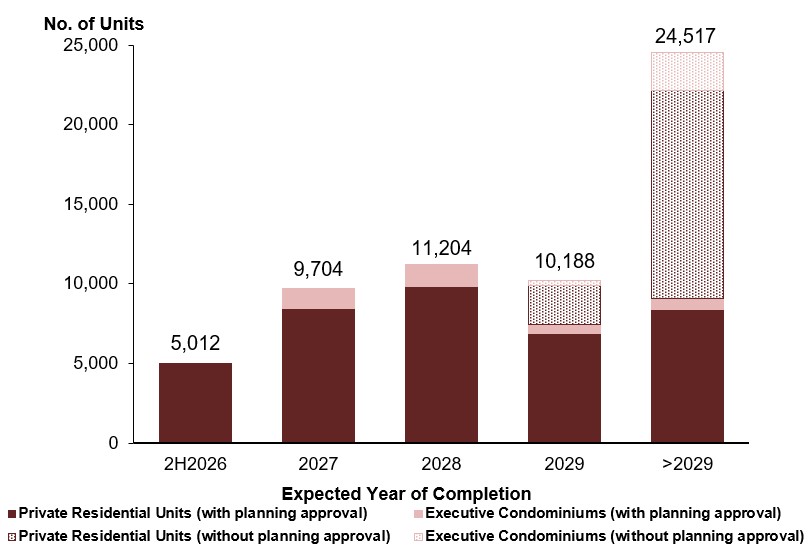
Note: 1,611 private residential units and 872 executive condominiums were completed (i.e. obtained TOP) in 1H2026.
Stock and Vacancy
16 The stock of completed private residential units (excluding ECs) increased by 416 units in 2nd Quarter 2026, compared with the increase of 813 units in the previous quarter. The stock of occupied private residential units (excluding ECs) decreased by 387 units in 2nd Quarter 2026, compared with the increase of 225 units in the previous quarter. As a result, the vacancy rate of completed private residential units (excluding ECs) increased to 6.4% as at the end of 2nd Quarter 2026, from 6.2% in the previous quarter (see Annex E-1).
Stock and vacancy of private residential units (excluding ECs)
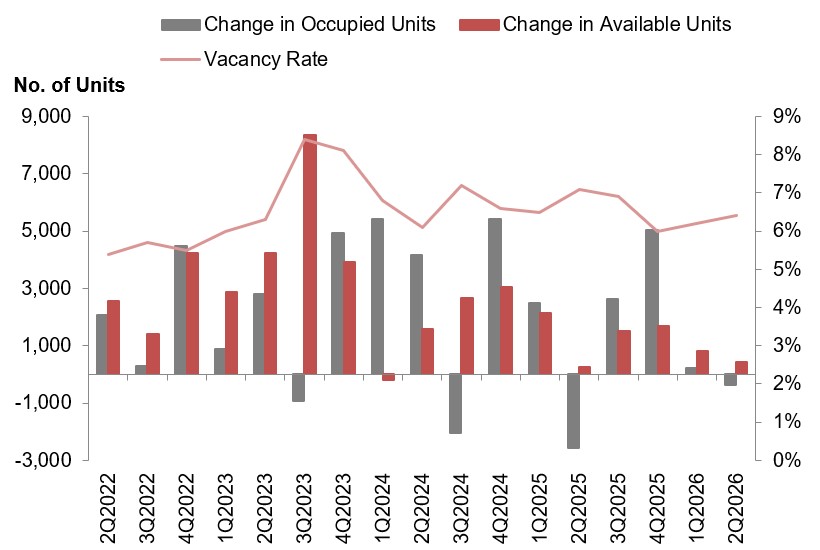
17 Vacancy rates of completed private residential properties as at the end of 2nd Quarter 2026 in CCR, RCR and OCR were 8.3%, 6.1% and 5.6% respectively, compared with the 8.2%, 6.3% and 5.2% in the previous quarter.
OFFICE SPACE
Overview:
Prices and Rentals
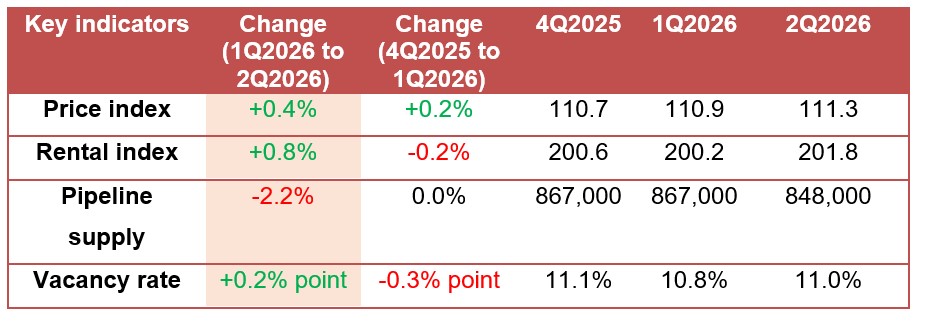
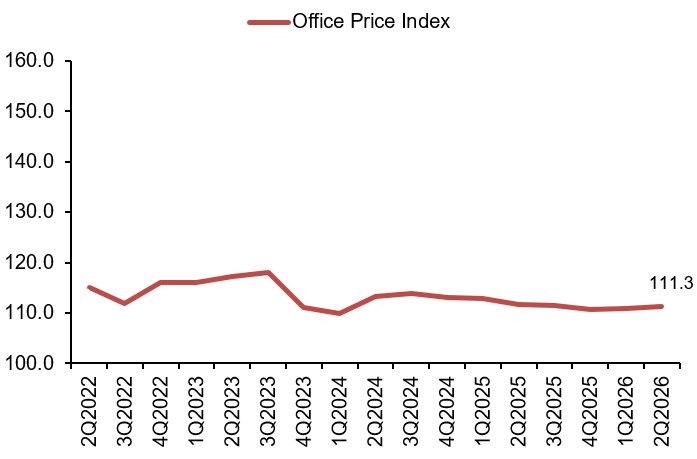
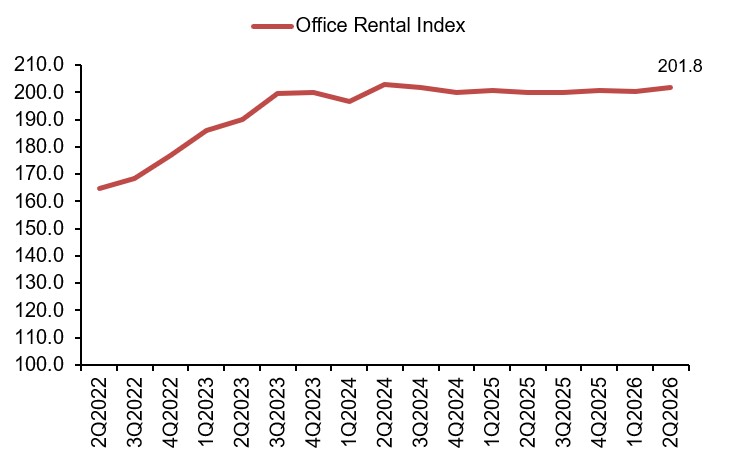
18 Prices of office space increased by 0.4% in 2nd Quarter 2026, compared with the 0.2% increase in the previous quarter (see Annex A-1). Rentals of office space increased by 0.8% in 2nd Quarter 2026, compared with the 0.2% decrease in the previous quarter (see Annex A-2).
Property Price Index of office space in Central Region
Rental Index of office space in Central Region
Note: Office rental statistics, including breakdown by location, floor area and building class, as well as street-level rental data, are updated quarterly and can be accessed at
https://eservice.ura.gov.sg/property-market-information/pmiCommercialRentalOfficeAnalysis and https://eservice.ura.gov.sg/property-market-information/pmiCommercialRentalStatsByStreet
Supply in the Pipeline
19 As at the end of 2nd Quarter 2026, there was a total supply of about 848,000 sq m GFA of office space in the pipeline, compared with the 867,000 sq m GFA of office space in the pipeline in the previous quarter (see Annexes E-1 & E-2).
Pipeline supply of office space
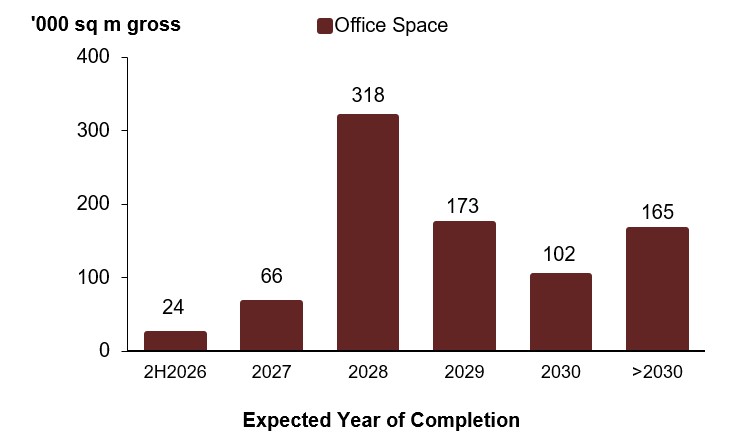
Note: 47,374 sq m of office space was completed (i.e. granted TOP) in 1H2026.
Stock and Vacancy
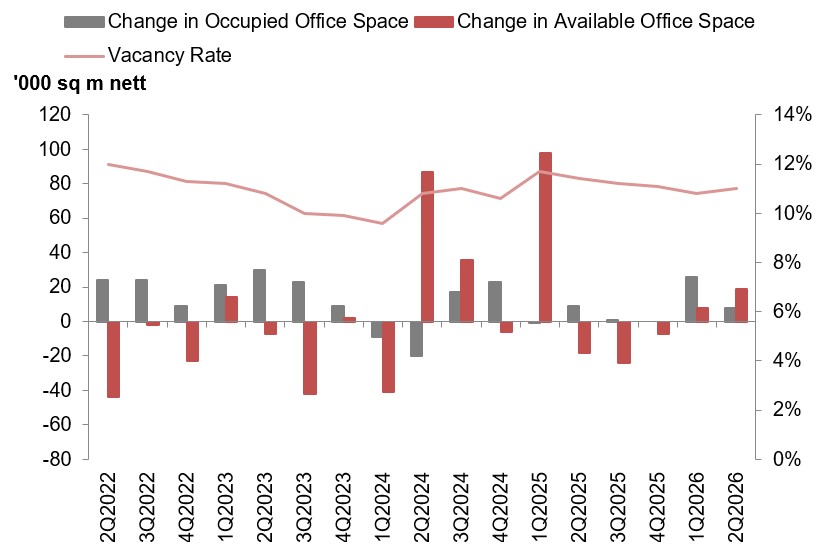
20 The amount of occupied office space increased by 8,000 sq m (nett) in 2nd Quarter 2026, compared with the increase of 26,000 sq m (nett) in the previous quarter. The stock of office space increased by 19,000 sq m (nett) in 2nd Quarter 2026, compared with the increase of 8,000 sq m (nett) in the previous quarter. As a result, the island-wide vacancy rate of office space increased to 11.0% as at the end of 2nd Quarter 2026, from 10.8% as at the end of the previous quarter (see Annex E-1).
Stock and vacancy of office space
Note: Vacancy rate statistics for office spaces, including breakdown by building class, are updated quarterly and can be accessed at https://eservice.ura.gov.sg/property-market-information/pmiCommercialTimeseries
RETAIL SPACE
Overview:
Prices and Rentals
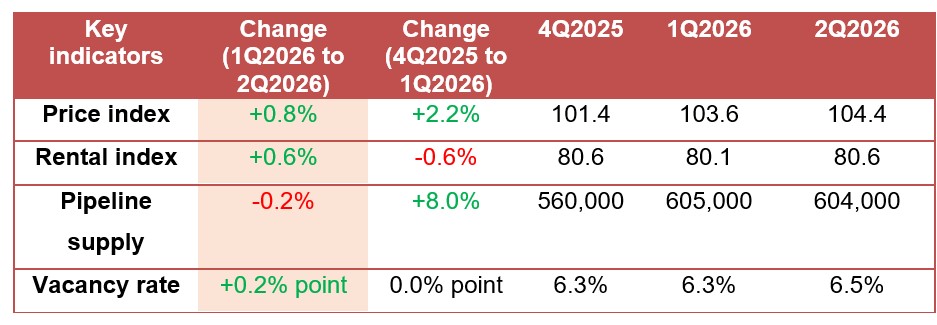
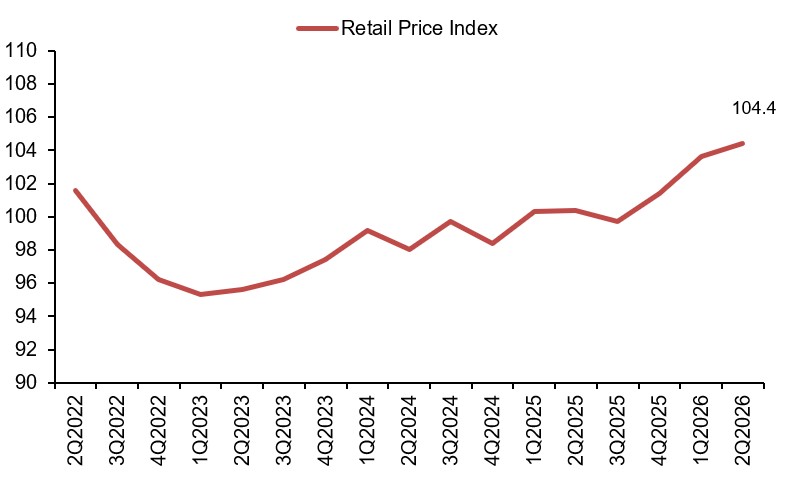
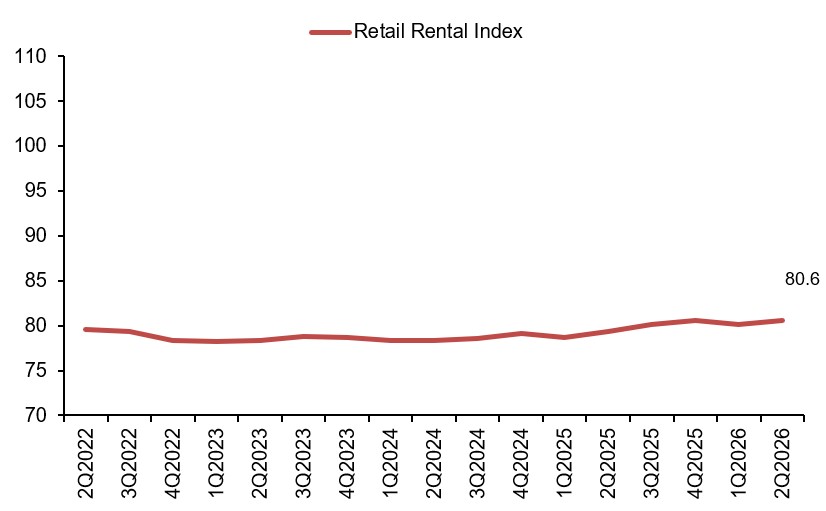
21 Prices of retail space increased by 0.8% in 2nd Quarter 2026, compared with the 2.2% increase in the previous quarter (see Annex A-1). Rentals of retail space increased by 0.6% in 2nd Quarter 2026, compared with the 0.6% decrease in the previous quarter (see Annex A-2).
Property Price Index of retail space in Central Region
Rental Index of retail space in Central Region
Note: Retail rental statistics, including breakdown by postal district, floor level and floor area, as well as street-level rental data, are updated quarterly and can be accessed at
https://eservice.ura.gov.sg/property-market-information/pmiCommercialRentalRetailAnalysis and https://eservice.ura.gov.sg/property-market-information/pmiCommercialRentalStatsByStreet
Supply in the Pipeline
22 As at the end of 2nd Quarter 2026, there was a total supply of about 604,000 sq m GFA of retail space in the pipeline, compared with the 605,000 sq m GFA of retail space in the pipeline in the previous quarter (see Annexes E-1 & E-2).
Pipeline supply of retail space
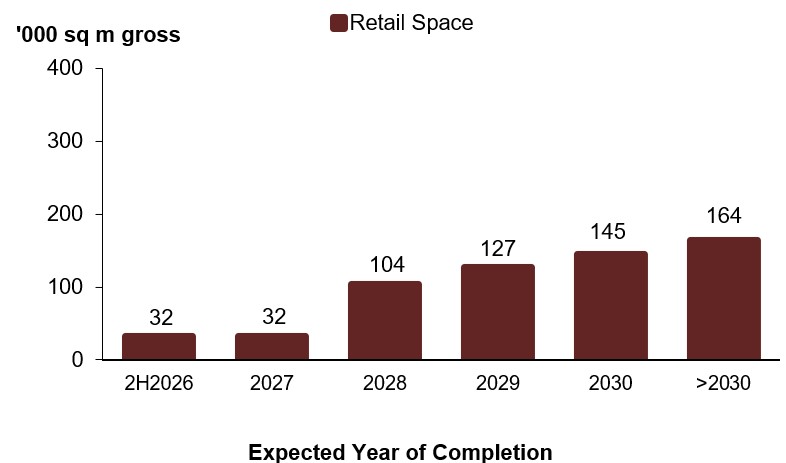
Note: 14,779 sq m of retail space was completed (i.e. granted TOP) in 1H2026.
Stock and Vacancy
23 The amount of occupied retail space decreased by 37,000 sq m (nett) in 2nd Quarter 2026, compared with the increase of 6,000 sq m (nett) in the previous quarter. The stock of retail space decreased by 28,000 sq m (nett) in 2nd Quarter 2026, compared with the increase of 10,000 sq m (nett) in the previous quarter. As a result, the island-wide vacancy rate of retail space increased to 6.5% as at the end of 2nd Quarter 2026, from 6.3% as at the previous quarter (see Annex E-1).
Stock and vacancy of retail space
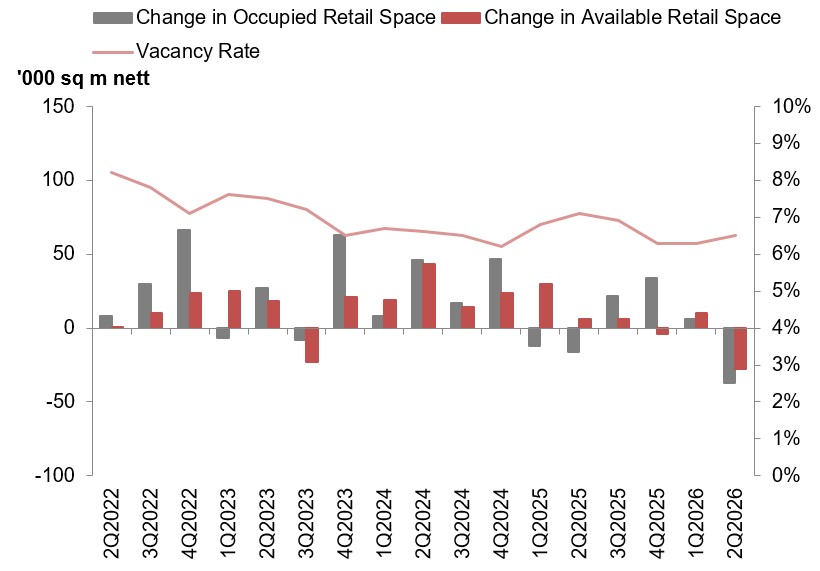
Note: Vacancy rate statistics for retail spaces, including the breakdown by location, are updated quarterly and can be accessed at https://eservice.ura.gov.sg/property-market-information/pmiCommercialTimeseries
URA’S REAL ESTATE INFORMATION SERVICE
24 Real estate information, such as time series statistics, are available on the URA website. Visit https://eservice.ura.gov.sg/property-market-information/pmiResidentialTimeseries for time series statistics on private residential properties and https://eservice.ura.gov.sg/property-market-information/pmiCommercialTimeseries for time series statistics on commercial properties.
25 Detailed information on the price and rental indices, supply in the pipeline, stock and vacancy rates of the various property sectors can be found in the Real Estate Information System (REALIS) at https://eservice.ura.gov.sg/reis.
26 The figures in this release are accurate as of 24 July 2026. Please visit the URA website or REALIS for the most updated figures.
SUMMARY OF KEY INFORMATION FOR 2ND QUARTER 2026
|
Annex |
Title |
|---|---|
|
Comparison of Property Price Index for 1st Quarter 2026 and 2nd Quarter 2026 |
|
|
Comparison of Rental Index for 1st Quarter 2026 and 2nd Quarter 2026 |
|
|
Number of Unsold Private Residential Units from Projects with Planning Approvals |
|
|
Number of Uncompleted Private Residential Units Launched in the Quarter by Market Segment |
|
|
Number of New Sale, Sub-Sale and Resale Transactions for Private Residential Units by Market Segment |
|
|
Stock & Vacancy and Supply in the Pipeline as at End of 2nd Quarter 2026 |
|
|
Supply in the Pipeline and Expected Year of Completion as at End of 2nd Quarter 2026 |
|
|
Pipeline Supply of Private Residential Units and Executive Condominiums by Expected Year of Completion as at End of 2nd Quarter 2026 |
|
|
Number of Private Residential Units and Executive Condominiums Completed in the Quarter |
|
|
Number of Executive Condominium Units Launched and Sold in the Quarter |