
Quick overview
- Gold spot is currently priced at $4,553.71, showing a marginal gain of 0.08% while forming a symmetrical triangle on the two-hour chart.
- Central bank accumulation, particularly by the People’s Bank of China, remains a critical bullish factor for gold despite ongoing geopolitical risks.
- The recent stickiness of inflation has led to a re-evaluation of rate cut expectations, which may favor gold in the long term but not in the immediate future.
- Traders should prepare for potential sharp price movements as gold approaches key support levels amid upcoming retail sales and inflation data releases.
Gold spot is displaying an obvious structural squeeze with spot quotes currently priced at $4,553.71 and registering a decent 0.08% marginal gain. The precious metal is wrapping up a clear symmetrical triangle on the two hour timeframe with a highly compressed price action that balances the ongoing unwind of a geopolitical risk premium with the unwavering structural accumulation by official sector institutional buyers.
Primary Fundamentals
- Ongoing Central Bank Accumulation: The iron-clad underlying fundamental floor of dedicated central bank accumulation demand remains the single most critical bullish factor. The People’s Bank of China has purchased gold for over 17 consecutive months. This steady, institutional buying demand offsets the cyclical risk-liquidations of weaker currencies.
- The Stickiness of Headline April CPI: The lingering April headline 3.8% headline CPI print continues to impact the near term capital flow trends. With inflation proving more sticky than the market initially expected, macro portfolio managers have re-scaled back rate cut expectations with Fed Chairman Kevin Warsh. This re-rating helps keep real rates higher, which generally favors gold, but not in the short run as capital continues to rotate into higher yielding fixed income instruments.
- Conditional Iran-US Ceasefire: The conditional Iran-US ceasefire is now holding a seven week extension as energy transport corridors through the Strait of Hormuz are re-opening. While there are clear geopolitical risks still in play, with the current immediate geopolitical risk premium draining, there is not yet an immediate re-bid into safe haven spot gold prices in the short term.
Gold Technical Outlook: Chart Overview
The two hour chart depicts a remarkably precise symmetrical triangle formation. Gold continues to compress in a tightly defined range between the immediate upper red downtrend line and the slowly rising lower green support line anchored off the previous multi-week price support low of $4,474.
With price action in a nearly complete squeeze against an apex, sellers appear to be aggressively defending the $4,553 to $4,560 spot levels with heavy supply orders and stalling any attempt at upside momentum.
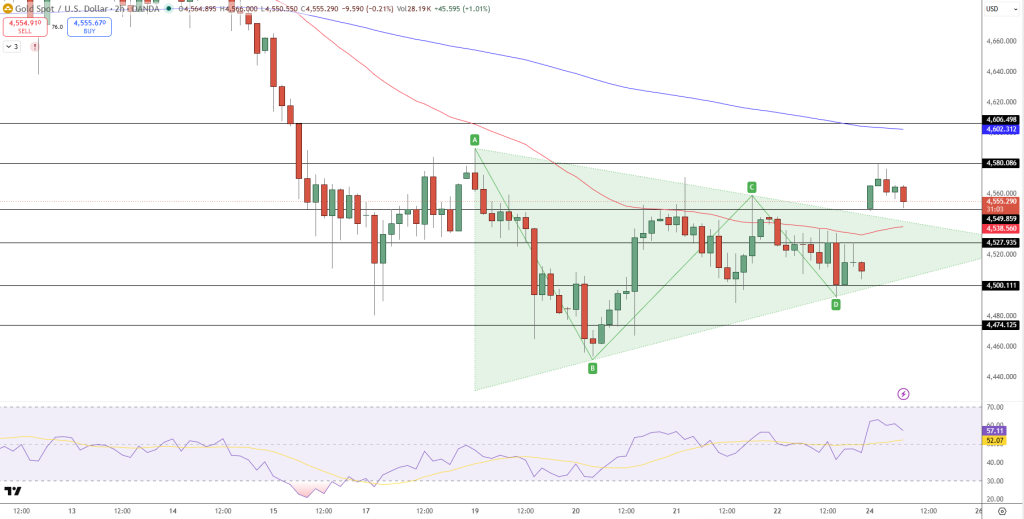
The 14-period RSI is sitting neutral at 56.54 in a slight bullish orientation without any divergence and moving averages are flat with no clear directional bias. All evidence points toward an imminent spike in volume as the price range contraction nears completion.
Important Resistance: $4,560 at the triangle top, $4,580, and the major psychological barrier at $4,606.
Major Support: $4,527 to $4,538, at the triangle base, $4,500, and $4,474 further back in deeper price demand.
Trade Plan
We are currently watching a tightly wound continuation pattern setup with price compressing to the apex:
- Entry Strategy: Buy Stop on a valid breakout and close of the two hour candle over $4,560.
- Take Profit: Take Profit target 1 (TP1) at $4,580, with a second profit target (TP2) at $4,602.
- Stop Loss: Placed beneath the lower green ascending trend line at $4,527.
Summary
Our short-term technical gold price outlook remains bullish for a breakout from the triangle with the price set up for a potentially $100+ expansion in either direction. While near term monetary policy changes with Fed Chairman Warsh have been a headwind for the metal, long term gold price expectations from banks remain higher with year-end forecasts ranging $5,400 to $6,300 and the bullish macro trend intact for gold’s longer term macro bullish thesis. The retail sales data releases and inflation report this week will likely produce a significant price move as gold approaches its current support levels, and with that in mind, traders should expect to see sharp price action surrounding these important economic data points.

Arslan Butt
Lead Markets Analyst – Multi-Asset (FX, Commodities, Crypto)
Arslan Butt serves as the Lead Commodities and Indices Analyst, bringing a wealth of expertise to the field. With an MBA in Behavioral Finance and active progress towards a Ph.D., Arslan possesses a deep understanding of market dynamics.
His professional journey includes a significant role as a senior analyst at a leading brokerage firm, complementing his extensive experience as a market analyst and day trader. Adept in educating others, Arslan has a commendable track record as an instructor and public speaker.
His incisive analyses, particularly within the realms of cryptocurrency and forex markets, are showcased across esteemed financial publications such as ForexCrunch, InsideBitcoins, and EconomyWatch, solidifying his reputation in the financial community.