
Aprotic electrolyte-based Li–CO2 cell
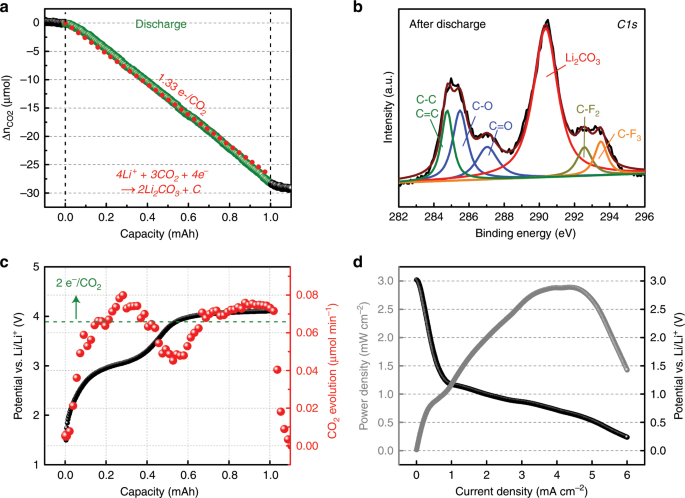
Following recent Li–CO2 battery studies (Supplementary Table 1), we first fabricated a cell consisting of a Li metal anode, carbon cathode, and 1 M lithium bis(trifluoromethanesulfonyl)imide (LiTFSI) in tetraethylene glycol dimethyl ether (TEGDME) electrolyte to monitor the CO2RR during the galvanostatic discharge process by using pressure decay measurement. As shown in Fig. 1a, the linear drop of consumed CO2 molecules indicates that the value of the electrons per CO2 ratio is ~1.32, which agrees well with the previously proposed discharge electrochemical reaction of 4Li+ + 3CO2 + 4e− → 2Li2CO3 + C (2.80 V vs. Li/Li+)5. In addition, the C1s X-ray photoelectron spectroscopy (XPS) spectra of a 1 mAh discharged carbon cathode presented a strong peak at 290 eV as shown in Fig. 1b, revealing the formation of Li2CO3 during the discharge process (Supplementary Fig. 1)8. However, the amount of CO2 evolution during the charge process measured by DEMS in Fig. 1c shows that the electrochemical reaction clearly does not follow the discharge reaction of 4Li+ + 3CO2 + 4e− → 2Li2CO3 + C (2.80 V vs. Li/Li+)5. In particular, the different electrochemical reactions and multiple charging plateaus during the charging process have been reported5,7. For instance, Qiao et al. showed that there are several different pathways to decompose the stable Li2CO35. Depending on the applied current and charging voltage, the electrons per CO2 can be either 1.5 or 2.0 e−/CO2 during the charging process, implying an irreversible electrochemical reaction in the Li–CO2 battery. In addition, Zhang et al. observed multiple plateaus with fluctuating evolution rates of CO2 gas during the charging process7. Nevertheless, to further understand this irreversible electrochemical reaction, we employed a carbon isotope (13C) cathode and performed linear-sweep voltammetry with the corresponding DEMS measurements (Supplementary Fig. 2). Although both 12CO2 and 13CO2 (mass weight of 45) are evolved at the same potential, the trace of the mass weight of 45 may not originate from 13CO2 because a previous study clearly showed that the decomposition of TEGDME generates fragment-45 owing to the generation of superoxide radicals during the decomposition of Li2CO3; these results are in good agreement with ours29. In addition, low peak power density of 2.9 mW cm−2 (Fig. 1d) and the evolution of H2 and CO2 gases at the potentials of 4.2 and 4.7 V in a fresh cell before discharging (Supplementary Fig. 3) clearly reveal further disadvantages of using aprotic solvent, which ultimately leads us to attempt an alternative electrolyte for high-performance Li–CO2 cell. It is noted that the H2 evolution from the fresh cell is presumably due to the parasitic reaction between the aprotic electrolyte and the Li metal30,31.

a Plot of CO2 gas consumption during the galvanostatic discharge (200 μA). The Li–CO2 cell contains 1 M LiTFSI in TEGDME electrolyte. The red dots indicate the ideal electron-to-CO2 ratio of 1.33. b C1s XPS result of the carbon cathode after 1-mAh discharge. c Galvanostatic charge plot and the corresponding DEMS results of the Li–CO2 cell containing 1 M LiTFSI in TEGDME electrolyte. The green dots correspond to the theoretical amount of CO2 evolution. d Polarization and power-density curves of 1 M LiTFSI in TEGDME with a scan rate of 0.01 mA s−1.
Molten salt-based Li–CO2 cell
In order to reduce the overpotential at high-current densities during the charge process, we prepared a cell with nitrate-based quinary-molten salt for an aprotic solvent-free electrolyte. The low eutectic melting temperature of the quinary-molten electrolyte allows us not only to perform a systematic study of the Li2CO3 decomposition process in a wide temperature range from 100 to 150 °C but also to potentially use for CO2 capture from the high-temperature power plant flue gas (Supplementary Fig. 4)32. As shown in the galvanostatic discharge–charge profiles in Fig. 2a, we observed that the operating temperature plays a critical role in reducing the discharge and charge overpotential of the Li–CO2 battery. For instance, the Li–CO2 cell at 150 °C exhibits a discharge–charge potential gap of 0.7 V, whereas the cell at 100 °C exhibits an ~2.1 V potential gap. In addition, the multiple charging plateaus may be due to the parasitic reaction between the discharge product and the carbon surface, which we will discuss later in Fig. 4. The pressure-drop measurement and Li1s XPS analysis further verify the electrochemical reaction of Li–CO2 cell in the nitrate-based electrolyte (Fig. 2b and Supplementary Fig. 5). Although we observed a strong signal at 55.3 eV for the Li2CO3 compound, the measured electron-to-CO2 ratio of 2.0 is in contrast to the aprotic electrolyte-based Li–CO2 cell in Fig. 1. This different electrochemical reaction can be explained by the previous nitrate molten electrolyte-based Li–O2 battery studies because the regeneration of NO3− from NO2− leads to alter the conventional electrochemical reaction of Li–O2 cell33,34,35. In the case of nitrate molten salt in Li–CO2 cell, N1s XPS analysis in Fig. 2c shows the existence of NO2 compound after the discharge process, which is evidence that the nitrate anion is involved in the electrochemical reaction and altered the electrochemical reaction and discharge potential of Li–CO2 cell (Supplementary Table 2, Supplementary Figs. 6–7)33,34,35. However, during the charging process, the DEMS results in Fig. 2d found that the CO2 evolution rates varied with operating temperature. The CO2 evolution rate increases with decreasing operating temperature, ranging from ~2.0 e−/CO2 at 100 °C to ~6.0 e−/CO2 at 150 °C. The value of 0.02 μmol min−1 at 150 °C during the galvanostatic charging process indicates that the electrochemical reaction is irreversible and different from the discharge process. In addition, the shifted Li2CO3 peak and the remaining NO2 compound in the XPS analysis after discharge and charge cycles at 150 °C suggests the formation of a new adduct during the charging process that significantly reduces CO2 evolution (Fig. 2e–f). It is noted that the molten salt electrolyte exhibits monotonically increasing CO2 rate that may be due to the enhanced CO2 solubility at high temperature. We observed a sharp increase in the gas evolution after CO2 gas saturation by using a deep discharged cell that also provides electron-to-CO2 ratio in the molten electrolyte (Supplementary Fig. 8). Furthermore, we performed linear-sweep voltammetry and carried out the galvanostatic charging process with the corresponding DEMS measurements at 100 °C to confirm the contribution of CO2 evolution by using the 13CO2–12C and 12CO2–13C systems (Supplementary Fig. 9). Although we observed evidence of carbon decomposition in the linear-sweep voltammetry results for both systems, the galvanostatic charging process with the corresponding DEMS measurements showed marginal CO2 evolution from the carbon cathode, which indicates that CO2 evolution predominantly occurs from Li2CO3 decomposition at 100 °C (Supplementary Fig. 10).

a Galvanostatic discharge and charge profiles of a Li–CO2 battery with quinary-molten salt electrolyte at different operating temperatures (100–150 °C) at current density of 0.4 A g−1. b–c High-resolution XPS Li1s (b) and N1s (c) spectra of the carbon cathode after 1000 mAh g−1 discharge. d DEMS result of the Li–CO2 cell containing quinary-molten salt electrolyte at different operating temperatures during charge process in a. e–f The green dots correspond to the theoretical amount of CO2 evolution. High-resolution XPS Li1s (e) and N1s (f) spectra of the carbon cathodes after 1000 mAh g−1 discharge and charge processes. The black and red lines indicate the results at operating temperatures of 100 and 150 °C, respectively.
Reaction mechanism of Li2CO3 decomposition
Although the exact electrochemical reaction remains unclear, we examined the Li2CO3 decomposition mechanism by the density functional theory (DFT) calculation to explain the variation of generating the amount of CO2 depending on the operating temperature (i.e., 100 °C and 150 °C) of Li–CO2 cells (see the “Supplementary Methods” section and Supplementary Fig. 11). The Li2CO3 decomposition mechanism under implicit quinary-molten salt condition was divided into the electrochemical reaction step, where Li ion is extracted by the charge potential, and the thermodynamic reaction step, where the carbonate on the surface participates in the reaction. We compared the Li extraction energy and activation energy of CO2 formation reaction by NO2− to determine the reaction priority (Supplementary Fig. 12). Since the Li extraction energy (i.e., 2.79 and 3.24 eV for the first and second Li extraction, respectively) was lower than the activation energy of CO2 formation reaction (i.e., 4.01 eV), it was predicted that the CO2 formation reaction could occur after the Li extraction reaction. Thus, we suggest path a (Li2CO3 + NO2− → 2Li+ + CO2 + NO3− + 2e−) for the decomposition mechanism of Li2CO3 at 100 °C (Fig. 3a–c). In path a, after the two Li atoms were extracted, carbonate ion reacted with NO2− to produce [CO3NO2]− at the first intermediate state (IM1). From IM1 to IM2, a bridge O atom bonded to C and N atoms was moved to form NO3− and produce CO2. Then, CO2 was desorbed from the surface in the final state (FS). The full-charge N1s XPS analysis showed no peak of NO2− because of the generation of NO3− as we conjectured (Fig. 2f). At 150 °C, as shown in Fig. 3b–c, the Li2CO3 decomposition mechanism initially followed the same reaction process of path a. However, after CO2 and NO3− are formed on the surface (IM2’) in path b (2Li2CO3 + NO2− → 4Li+ + C2O52− + NO3− + 2e−), CO2 could react further with the adjacent carbonate to form C2O52− (FS’). Separately, the unstable carbonate could react with the adjacent carbonate to form C2O62− (FS”) in path c (2Li2CO3 → 4Li+ + C2O62− + 2e−), where NO2− was not used as the reactant in the Li2CO3 decomposition mechanism. The three paths in the reaction mechanisms predicted to be occurred at 150 °C were consistent with experimental results, where NO2− and NO3− presented on the surface and a small amount of CO2 was released (Fig. 2d–f). We speculated that the thermal energy at the higher temperature could promote the reactions of paths b and c; the activation energies of the two mechanisms (i.e., 1.39 eV for path b and 1.54 eV for path c at 150 °C) were higher than the activation energy for the mechanism to produce CO2 gas (i.e., 0.99 eV for path a at 100 °C). Interestingly, CO2 was favored in the adsorbed state considering the endothermic heat of reaction from IM2 to FS in path a without a transition state. This also could be a reason for CO2 to undergo the reaction step from IM2 to FS at 150 °C. All of the optimized configurations in each reaction mechanism are depicted in Supplementary Fig. 13. It should be noted that because the proposed pre-equilibrium electrochemical reactions are not the complete reaction mechanism of the charge process, the generation of the short-lived intermediate C2O62− produces new adducts, resulting in irreversible CO2 evolution at 150 °C in the DEMS measurements in Fig. 2.

a Reaction coordinate of one possible path a to produce CO2 and NO3− (black line) at 100 °C. b Reaction coordinate of three plausible pathways (i.e., path a, path b to produce C2O52− and NO3− (red line), and path c to produce C2O62− (blue line)) at 150 °C. c Optimized configurations on three plausible pathways for the reaction step corresponding to (a) and (b). IS, IM, and FS in each reaction mechanism represent the initial state, intermediate state, and final state, respectively. The yellow dotted line is the boundary between the Li extraction step and the reaction step, and the numbers represent the relative free energies based on those of bare surface in (a) and (b). Nitrogen, potassium, carbon, oxygen, and lithium atoms are colored in green, purple, light gray, pink, and sky blue. For a clear view, the carbon, oxygen, and lithium atoms, which participate in the reaction, are colored in dark gray, red, and blue. Arrow dotted lines represent the movement of molecules from state to state. For a clear view, the molecules, except reacting molecules, were made to be translucent in (c).
Electrochemical performance of Li–CO2 cell
To investigate the high-current performance of the quinary-molten salt electrolyte, we evaluated the galvanostatic discharge–charge characteristics of the Li–CO2 cell under a current-density range of 1.0–20.0 A g−1 (Fig. 4a). As shown in the plots, the discharge–charge overpotentials were dominantly affected by the applied current densities. For instance, the Li–CO2 battery at an applied current density of 1.0 A g−1 had the lowest discharge–charge potential gap of 1.0 V, whereas that at an applied current of 20.0 A g−1 showed the highest potential gap of 1.7 V (Fig. 4b). Although the discharge–charge overpotential gap monotonically increases with increasing applied current density, the stable discharge–charge profiles at 20.0 A g−1 clearly suggest that the high-temperature operation of quinary-molten salt at 150 °C efficiently enhances the rate performance of the Li–CO2 battery, which is one of the desired battery characteristics and also has the advantage of capturing CO2 gas from power plants because the high-current density increases the CO2 capture rate (Supplementary Fig. 14). In addition, we observed a high peak power density of 19.7 mW cm−2 from the quinary-molten salt-based Li–CO2 cell (Fig. 4c); this value is approximately seven times higher than that of the conventional Li–CO2 battery with 1 M LiTFSI in the TEGDME electrolyte (Fig. 1d). We also measured the power density with another ternary-molten salt (37 mol% LiNO3, 39 mol% KNO2, and 24 mol% CsNO3) electrolyte at 150 °C (Supplementary Fig. 15). Although the peak power density of 16.2 mW cm−2 is slightly lower than that of the quinary-molten salt electrolyte, the ternary-molten salt also increases the electrochemical performance in the Li–CO2 battery. The Li–CO2 battery with quinary-molten salt further allows us to observe the long-term cycle capability. As shown in Fig. 4d, the results show stable discharge–charge plots over 100 cycles at a high-current density of 2.0 A g−1. We observed that the charge overpotential decreases as the number of cycles increases in Fig. 4d. One plausible explanation is the parasitic reaction between Li2CO3 and the carbon defect sites. Because most metal–gas batteries use the capacity cutoff for cycle measurement, a discharge product is formed on a fresh carbon surface every cycle, which causes a parasitic reaction and multiple plateaus during the charging process. Thus, to mitigate the effect of the carbon surface, we also monitored the second cycle after the potential cutoff operation at the first cycle and observed a single charging plateau, indicating that the carbon surface is important for reducing the parasitic reaction during the charging process (Supplementary Fig. 16).

a Galvanostatic discharge–charge profiles of the Li–CO2 battery with quinary-molten salt electrolyte at different current densities from 1.0 to 20.0 A g−1 at 150 °C. b Plots of discharge–charge overpotential measured at 500 mAh g−1 as a function of current density. c Plots of operating voltage and power density versus current density of the Li–CO2 battery at 150 °C with scan rate of 0.01 mA s−1. d Galvanostatic discharge–charge profiles of a Li–CO2 cell with 2.0 A g−1 current density over up to 100 cycles.
Synthesis of Ru nanoparticles by using Joule heating
Further enhancement of the Li–CO2 cell can be achieved by a carbon cathode with Ru catalyst, because previous reports of Li–CO2 batteries by using aprotic electrolytes indicate that the cathode catalyst efficiently promotes the decomposition of Li2CO318,24. As schematically shown in Fig. 5a, RuCl3 in H2O solution was mixed thoroughly with Super P carbon powder by a Thinky mixer for 10 min; then, the composite slurry was coated onto the carbon paper to apply the high current. In particular, the Joule heating method allows us not only to homogeneously disperse the Ru nanoparticles with a controlled size but also to reduce the thermal decomposition time of RuCl336,37,38. After a systematic study of Ru nanoparticles with various particle sizes and populations (Fig. 5b (inset) and Supplementary Fig. 17), we found well-developed Ru nanoparticles on the carbon cathode from the optimum conditions of 2:1 weight ratio (Super P:Ru) slurry at 8 A for 1 s. A high-resolution transmission electron microscopy (HR-TEM) measurement further showed well-dispersed Ru particles on the carbon cathode (Fig. 5b). The magnified image in Fig. 5c shows the fringes of the crystalline structure of Ru nanoparticles, where the d-spacing of 0.21 nm represents the (101) plane of the Ru crystal39. Moreover, the energy-dispersive spectroscopy (EDS) mapping of Ru further supports the well-dispersed Ru nanoparticles on the carbon cathode surface in Fig. 5d (inset image is the mapping of the carbon element), confirming that the Joule heating method is a simple but potent way to develop the Ru catalyst, making it a suitable cathode for Li–CO2 batteries without a polymeric binder40.

a Schematic illustration of the fabrication procedure of Ru nanoparticles on the carbon cathode by using the Joule heating method. The inset shows a photograph of light emitting from the carbon cathode during Joule heating. Scale bar is 1 cm. b Bright-field TEM micrograph and SEM image (inset) of the carbon cathode with Ru nanoparticles after applying 8 A for 1 s. Scale bars are 200 nm. c High-resolution TEM image of Ru nanoparticles on the carbon cathode. Scale bar is 5 nm. d EDS mapping of Ru and C (inset) elements of the TEM image in (b). Scale bars are 200 nm.
Synergistic effect of the molten salts and Ru nanoparticles
To evaluate the synergistic effect of the quinary-molten salts and Ru nanoparticles on the carbon cathode on the Li–CO2 cell performance, we performed galvanostatic discharge–charge measurements with current density ranging from 1.0 to 20.0 A g−1 at 150 °C (Fig. 6a). The Ru nanoparticles on the carbon cathode were observed to further reduce the overpotential with a high discharge capacity to form a Li2CO3 discharge product (44,000 mAh g−1 at 10.0 A g−1 (Supplementary Figs. 18–19)). Although the proposed discharge reaction shows continuous consumption of NO3− during the discharge process, highly concentrated NO3− in the molten salt electrolyte does not significantly alter the electrochemical performance during the discharge process. In addition, the cell operates even at a high-current density of 20.0 A g−1 and enhances the CO2-capturing capacity, in contrast to the aprotic electrolyte-based Li–CO2 battery with a Ru catalyst (Supplementary Fig. 20)24. We observed a sufficiently stable cycle capability of the Li–CO2 battery at a current density at 2.0 A g−1 (Fig. 6b), 5.0 A g−1 (Fig. 6c), and 10.0 A g−1 (Fig. 6d) at 150 °C. In particular, the cells are sustained for over 300 cycles at 10.0 A g−1 without significant alteration of the voltage potential. Moreover, the Ru nanoparticles in quinary-molten salt exhibited a peak power density approximately two times that of quinary-molten salt without Ru nanoparticles, indicating that the synergistic effect of Ru nanoparticles further reduces the energy barrier during the electrochemical reaction of the Li–CO2 battery (Fig. 6e). In particular, we theoretically revealed that the addition of the Ru surface induced the electron transfer from CO2− to Ru particles to stabilize CO2−, reducing the energy of the thermodynamic barrier (i.e., overpotential) (Supplementary Figs. 21–23). Consequently, the power density of Li−CO2 battery was enhanced. As summarized in Fig. 6f, the peak power density of 33.4 mW cm−2 is 13 times higher than that of the conventional Li–CO2 battery with the aprotic electrolyte (Supplementary Figs. 24–25), suggesting that the quinary-molten salts and the Ru nanoparticles on the carbon cathode make the Li–CO2 cell a feasible high-performance CO2 capture and energy-storage system.

a Galvanostatic discharge–charge profiles of the Li–CO2 battery with quinary-molten salt electrolyte with a Ru nanoparticle cathode at different current densities from 1.0 to 20.0 A g−1 at 150 °C. Cycling performance of the Li–CO2 battery at current rates of 2.0 A g−1 (b), 5.0 A g−1 (c), and 10.0 A g−1 (d). e Polarization and power-density curves of quinary-molten salt electrolyte with the Ru nanoparticle cathode with a scan rate of 0.01 mA s−1. f Plots of peak power density of 1 M LiTFSI in TEGDME (gray); quinary-molten salt at 100, 110, 130, and 150 °C (blue); quinary-molten salt electrolyte with a Ru nanoparticle cathode at 150 °C (orange).