
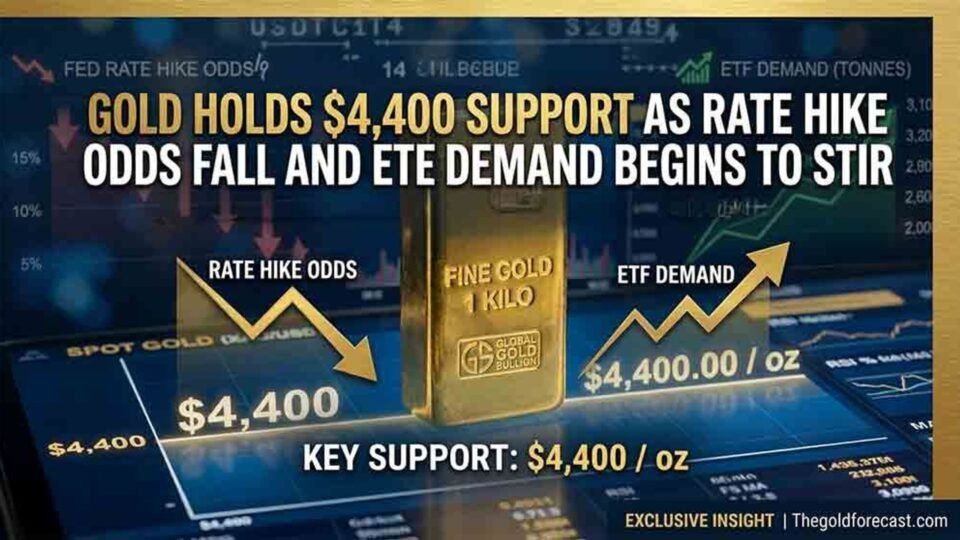
Gold continues to find its footing at the $4,400 level, even as fresh data from the World Gold Council reveals persistent weakness in overall U.S. demand during the second quarter. The technical picture remains one of consolidation rather than capitulation, and the fundamental backdrop is shifting measurably in gold’s favor. The CME FedWatch Tool now prices a September rate hike at just 32.5% the lowest probability reading since the current tightening cycle began while markets assign a 67.5% chance to a quarter-point hike at the upcoming September meeting. That repricing of Federal Reserve expectations, combined with a softening dollar and persistent geopolitical uncertainty, helped bullion rally roughly 10% through August, touching a two-month high above $4,449 before consolidating near current levels.
The demand figures themselves tell a complicated story. Total U.S. gold demand remained under severe pressure in Q2, falling to just 8 tonnes well below its 10-year quarterly average of 90 tonnes and bringing the H1 total to only 41 tonnes. The decline was driven almost entirely by continued outflows from U.S.-listed, physically backed gold ETFs, where holdings fell by 40 tonnes in June alone, compared with a combined 4-tonne decline over April and May. That pattern of concentrated quarter-end selling mirrors what occurred in Q1 and underscores how episodic, rather than chronic, the liquidation pressure has actually been. For the full first half, U.S. gold-backed ETFs recorded net outflows of 61 tonnes, marking the fourth-largest H1 decline in holdings on record and the second-largest in U.S. dollar terms.
Critically, however, the weakness was concentrated, not continuous. Excluding the outsized March and June outflows, U.S. gold-backed ETFs would have recorded 65 tonnes of net inflows in H1. That reframing matters enormously for interpreting what lies ahead. Those two discrete liquidation episodes, the largest monthly outflow in dollar terms in March and the third-largest in June gave a false reading of consistent mass liquidation.
Across other demand segments, the results were mixed. Bar and coin demand increased year-over-year but fell short of Q1 levels, as range-bound prices limited fresh buying momentum and sell-back activity moderated from the elevated pace seen earlier in the year. Jewelry demand remained soft in volume terms, though the value of purchases rose year-over-year as elevated prices pushed consumers toward lighter-weight and lower-carat products. The weakness was most pronounced in the mass market, while higher-end jewelry proved more resilient, reinforcing the recent trend of higher-income households commanding a larger share of retail spend.
What makes the current setup particularly compelling is that gold’s August advance has unfolded without the kind of widespread ETF participation that typically accompanies euphoric peaks. Data from Bank of America and EPFR show gold funds recording their strongest weekly inflow since January in recent weeks, signaling that investor demand is only beginning to revive. Global physically backed gold ETFs added 23 tonnes in July, lifting holdings to 4,068 tonnes and pushing assets under management to roughly $530 billion a meaningful reversal that coincides directly with the shift in rate expectations. ETF shares outstanding nonetheless remain well below levels seen at previous gold market peaks, which means positioning is lean even after the recent advance and the fuel for a further move higher has not yet been spent.
Central bank buying provides an additional and durable demand floor. According to data cited by Reuters, central banks purchased a record 289 tonnes in the second quarter, a structural source of demand that operates largely independent of short-term rate dynamics or ETF sentiment. That combination of record institutional buying, reviving retail ETF flows, and fading rate-hike expectations creates a more layered demand profile than gold enjoyed during the first half, when the market was carrying the weight of concentrated ETF outflows against an otherwise supportive backdrop.
The levels to watch remain $4,400 on the downside and $4,500 on the upside, where profit-taking has already emerged this week. A continued fade in rate-hike expectations, accompanied by further improvement in weekly ETF flow data, would suggest that today’s relatively light positioning could become the catalyst for another advance toward and ultimately through the $4,500 resistance zone. Conversely, any resurgence in inflation data that revives expectations for further Fed tightening would undermine the setup quickly. In the sessions ahead, subscribers should track the dollar, real yields, and the weekly ETF flow reports closely those three variables will likely determine whether gold’s next significant move is a continuation higher or a return to the lower end of its recent range.
For those who would like more info visit thegoldforecast.com.
Wishing you, as always, good trading.
Disclaimer: The views expressed in this article are those of the author and may not reflect those of Kitco Metals Inc. The author has made every effort to ensure accuracy of information provided; however, neither Kitco Metals Inc. nor the author can guarantee such accuracy. This article is strictly for informational purposes only. It is not a solicitation to make any exchange in commodities, securities or other financial instruments. Kitco Metals Inc. and the author of this article do not accept culpability for losses and/ or damages arising from the use of this publication.