Hello, fellow traders. In this technical article, we’ll take a quick look at the Elliott Wave charts of Gold (XAUUSD), recently published in the members’ area of our website.
As our members know, GOLD has been declining within the cycle that started from the August peak at 4698.17. Price has now reached the extreme zone and is already showing a reaction from the area.In the following sections, we will walk through the setup and show how we forecasted the path.
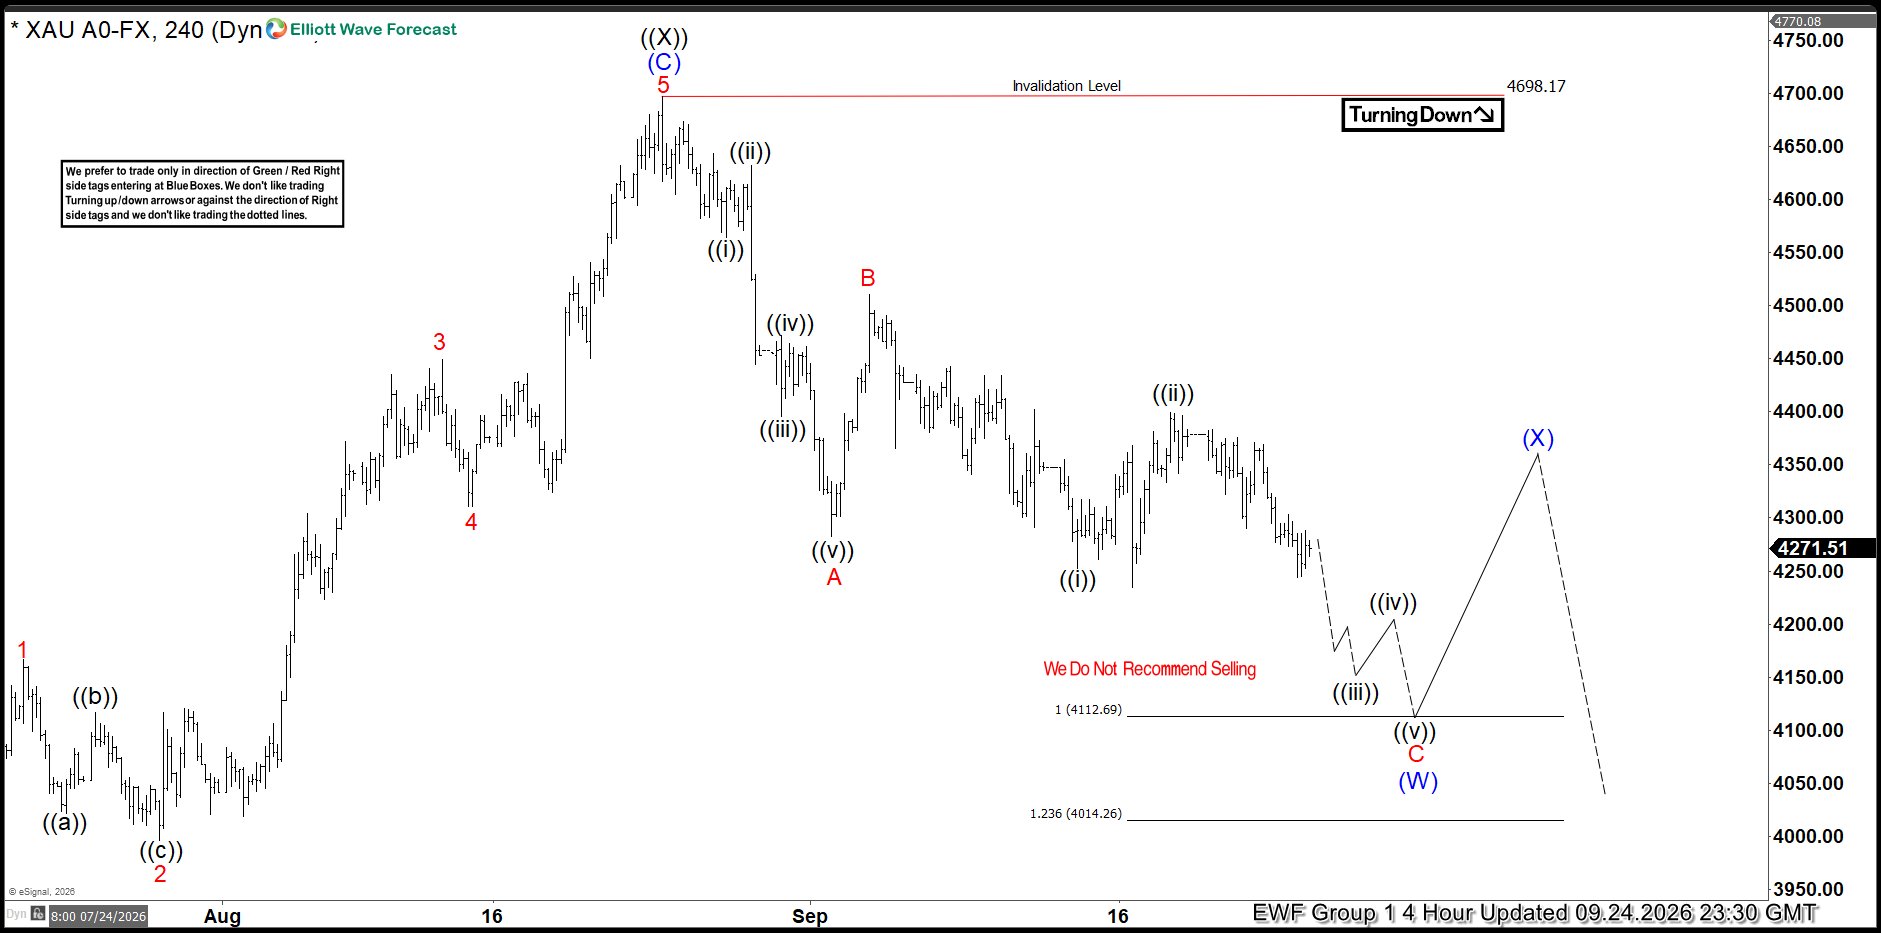
XAUUSD Elliott Wave 4 Hour Chart 09.24.2026
XAUUSD is forming a three-wave pattern from the recent August peak at 4698.17. At the moment, the structure of the pullback appears incomplete, suggesting that further downside could be seen before the next bounce develops. As our members know, the reversal zone is identified by measuring the Equal Legs area using the Fibonacci Extension tool, measuring A relative to B. The ideal target area comes in at 4112.6–4014.2.
From this zone, we expect buyers to step in and take control, potentially driving the price higher in at least a three-wave bounce.
90% of traders fail because they don’t understand market patterns. Are you in the top 10%? Put your skills to the test with this advanced Elliott Wave challenge.
Reminder : Our member chat rooms are open 24/7 and provide ongoing expert guidance on market trends and Elliott Wave analysis. Members are encouraged to ask questions about market structure and technical setups at any time. You can learn more about Elliott Wave Patterns at our Free Elliott Wave Educational Web Page
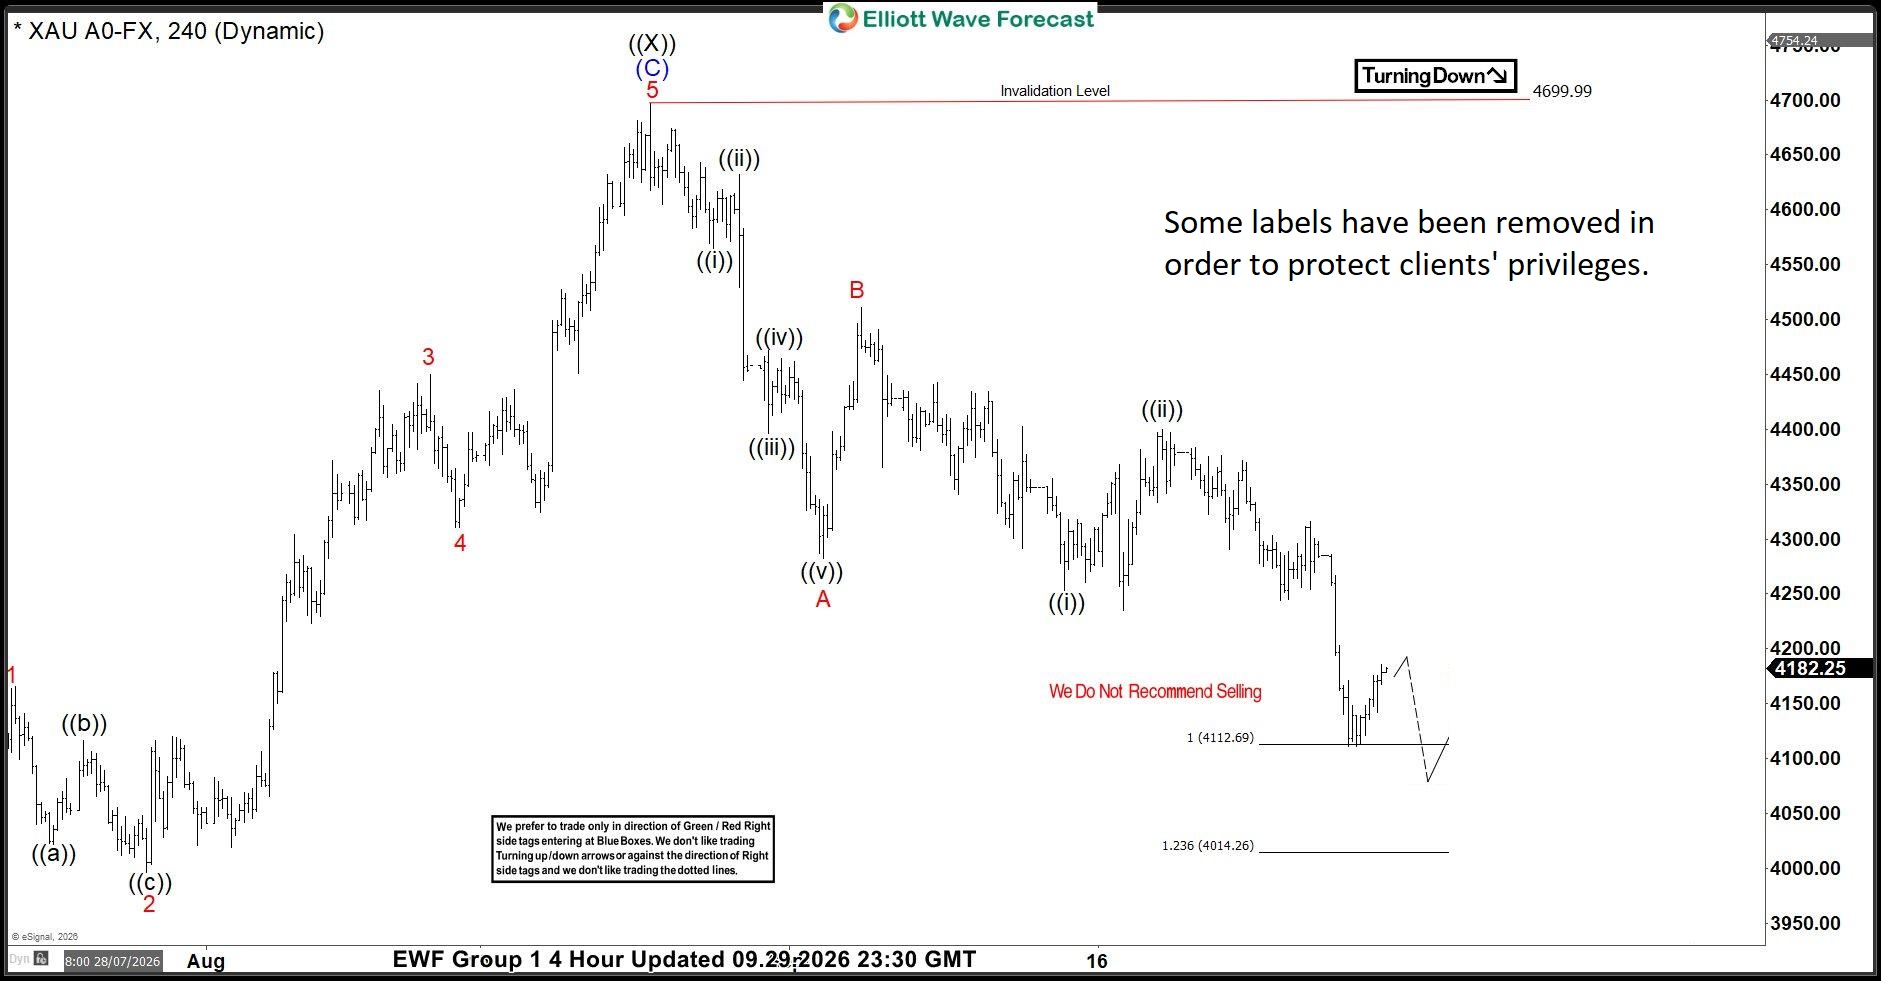
XAUUSD Elliott Wave 4 Hour Chart 09.24.2026
GOLD declined as expected and reached the extreme zone at 4112.6–4014.2. The commodity found buyers right at the Equal Legs area, producing a reaction from the zone. At this stage, it is still too early to determine with high confidence whether the cycle has already been completed. The preferred view suggests that the cycle is taking the form of an Elliott Wave Zig Zag pattern, meaning we could potentially see another low to complete five waves within the red C leg. For now, we will continue monitoring the structure and the reaction from the current area.
Keep in mind that the market is dynamic, and the outlook may have changed in the meantime. Our member Chat Rooms are open 24 hours a day, Monday through Friday, on trading days, providing ongoing expert guidance on market trends and Elliott Wave analysis. Members can ask questions about market structure and technical setups at any time during trading days.