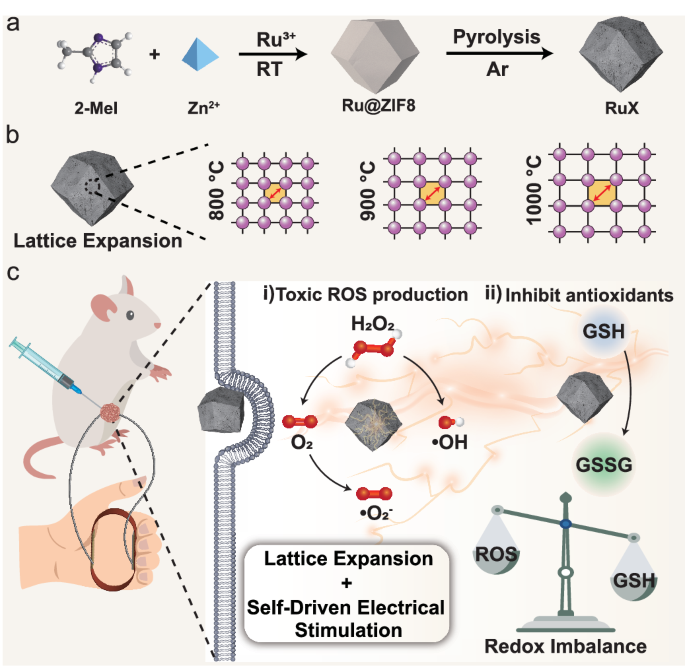
Synthesis and characterization of RuX nanozymes
Ru nanozymes with different Ru lattice spacing were synthesized using a facile two-step method, employing zeolitic imidazolate framework-8 (ZIF8) as the supporting substrate (Fig. 1a). Initially, ruthenium acetylacetonate was mixed with Zn2+ and 2-methylimidazole to produce ruthenium co-coordinated ZIF8 (Ru@ZIF8). Subsequently, the resultant product was carbonized under N2 atmosphere at varying temperatures (800, 900, and 1000 °C), yielding RuX, where X represents the temperature of 800, 900, or 1000 °C. We also carbonized ZIF8 without Ru loading, referred as NC1000, to serve as a control sample for comparing activity and analyzing catalytic mechanism. From the scanning electron microscopy images, RuX exhibited a gradual decrease in particle size from 121.1 to 66.6 nm with increasing carbonization temperature from 800 to 1000 °C, all of which were much smaller than NC1000 (~205.1 nm) (Supplementary Fig. 1). Transmission electron microscope images revealed the trapezoidal dodecahedron shape of RuX nanoparticles with uneven distribution of small nanocrystals throughout the substrate. Additionally, selected area electron diffraction patterns exhibited their crystal structures (Fig. 2a, Supplementary Fig. 2a and Supplementary Fig. 3a). Surface and line-scan elemental mapping of C, N, O and Ru also proved the successful Ru loading into the substrate (Supplementary Fig. 2– Supplementary Fig. 4). The size of Ru nanocrystals displayed a slight increase from 3.06 nm to 3.52 nm as the carbonization temperature rose from 800 to 1000 °C (Supplementary Fig. 5). From the high-resolution transmission electron microscopy images, the lattice spacing of Ru nanocrystals gradually and uniformly expended with higher carbonization temperatures, measuring 0.217 nm for Ru800, 0.225 nm for Ru900 and 0.230 nm for Ru1000 (Fig. 2b), representing expansion of 3.69% for Ru900 and 5.99% for Ru1000, respectively. We employed inductively coupled plasma optical emission spectroscopy to compare the Zn and Ru element contents in the RuX. The results revealed a gradual decrease in Zn content with increasing carbonization temperature, mainly attributed to thermal volatilization of Zn (Supplementary Table 1 and Supplementary Table 2). The Ru content in Ru900 and Ru1000 was similar (0.815 at% and 0.803 at%, respectively), approximately twice the content in Ru800 (0.424 at%). We tentatively deduced that at higher carbonization temperatures above the boiling point of Zn (907 °C), Zn gradually evaporated from the carbon matrix, potentially causing structural distortion of the carbon support and lattice expansion of Ru nanocrystals on the supports9,43,44. The lattice expansion in nanocrystals may induce local strain and electronic reconfiguration, altering the key functional properties substantially45,46,47,48,49.

a TEM image and selected area electron diffraction (SAED) pattern (inset) of Ru1000. b HR-TEM images of RuX (X = 800, 900, 1000, respectively). c XRD patterns of RuX. d Raman spectra of RuX. e XPS spectra of survey scan of RuX. f XPS spectrum of Ru 3p region of Ru1000. g Normalized XANES spectra of Ru1000, Ru900, RuO2, and Ru foil at Ru K-edge. Inset is the enlarged view of the pre-edge energy range of the samples. h Relationship between Ru K-edge absorption energy and valence states for Ru1000, Ru900, Ru foil, and RuO2. i FT-EXAFS spectra of Ru1000, Ru900, RuO2, and Ru foil. j Wavelet transform of Ru foil, RuO2, Ru900, and Ru1000. k Schematic illustration showing structure of Ru nanocrystals on N-doped carbon substrate (Ru900 or Ru1000). In (a, b) the experiments were repeated independently three times with similar results, and a representative result is shown for each. Source data are provided as a Source Data file.
We further employed X-ray diffraction (XRD) analysis to investigate their crystal structures (Fig. 2c). All RuX samples displayed two characteristic broad peaks at 2θ = 25° and 44°, corresponding to the interlayer lattice planes of (002) and (101) graphite microcrystals of carbon, respectively. With increasing carbonization temperature, the intensity of the diffraction peak at 44° progressively rose, indicating increased graphitized carbon at higher temperatures50,51. Raman spectra results exhibited clear D and G bands at around 1345 cm−1 and 1581 cm−1 for all Ru nanozymes (Fig. 2d). As the carbonization temperature increased from 800 °C to 1000 °C, the ID/IG ratio gradually decreased from 1.875 to 1.24, signifying an elevated degree of graphitization, consistent with the XRD results. The chemical state in RuX was evaluated using X-ray photoelectron spectroscopy (XPS), revealing the presence of elements C, N, O, Zn, and Ru (Fig. 2e, Supplementary Table 2). High-resolution Ru 3p and 3d spectra confirmed the coexistence of multivalent Ru (0, +3, and +4) in the three RuX samples (Fig. 2f and Supplementary Fig. 6a). Notably, the existence of multivalent Ru may be attributed to the coordination between the surface Ru in the Ru nanocrystals and N in the substrate, or the unavoidable surface oxidation of metallic Ru nanocrystals52,53. In the C 1s spectrum, the three peaks located at 284.64, 285.34, and 287.54 eV were assigned to C-C, C=N and C-N bonds, respectively (Supplementary Fig. 6b, Supplementary Table 3)23,39. The N1s spectra displayed decomposition peaks corresponding to pyridinic N, pyrrole N, and graphite N. Moreover, an additional peak attributed to Ru-N coordination was observed in the case of Ru1000. (Supplementary Fig. 6c, Supplementary Table 4).
With comparable Ru contents, we conducted further investigation into the fine electronic structure and coordination environment of Ru nanocrystals in Ru900 and Ru1000 using synchrotron radiation-based X-ray absorption near-edge structure (XANES) spectroscopy and extended X-ray absorption fine structure (EXAFS). The Ru K-edge XANES curves revealed that both Ru900 and Ru1000 exhibited higher energy absorption thresholds compared to Ru foil, yet lower than RuO2 (Fig. 2g). The results indicated that the valence states of Ru ranged from 0 to +4, suggesting a mixed local environment around Ru, which was consistent with the XPS results. Additionally, the average valence state of +1.44 in Ru1000 was lower than that of +2.17 in Ru900, indicating its closer resemblance to the metallic state (Fig. 2h). The EXAFS spectra displayed characteristic peaks of Ru-Ru bonds at 2.0–3.0 Å for both Ru900 and Ru1000, confirming the formation of Ru nanocrystals. Furthermore, compared to Ru900, the peak in Ru1000 displayed a slight redshift, indicating a slightly longer Ru-Ru bond length. Notably, a distinctive peak appeared at around 1.4 Å in Ru1000, which can be assigned to Ru−N coordination, as observed in its XPS spectrum (Fig. 2i).
Wavelet transforming of EXAFS was performed on Ru foil, RuO2, Ru900, and Ru1000 to investigate the dispersion of Ru on the N-doped carbon support (Fig. 2j). It is worth mentioning that the contour maps of both Ru900 and Ru1000 exhibited peaks at around 1.4 Å and 2.4 Å, corresponding to Ru-N and Ru-Ru coordination, respectively, indicating the presence of Ru particles. Quantitative EXAFS curve fitting results are displayed in Supplementary Fig. 7 and Supplementary Table 5. The coordination number of Ru-Ru bonds for Ru900 and Ru1000 were determined to be 1.2 ± 0.4 and 1.00 ± 0.03, respectively, with average bond lengths of 2.65 ± 0.02 Å and 2.67 ± 0.07 Å, respectively. These findings suggested that the lattice expansion in Ru nanocrystals led to a slight increase in the Ru-Ru bond length, subsequently increasing the unsaturation of the Ru-Ru bonds. Additionally, the specific surface area of Ru800, Ru 900, and Ru1000 assessed using nitrogen adsorption-desorption at 77.3 K were 679.1071, 703.2245, and 660.2020 m2 g−1, respectively, and they possessed similar pore size distribution (Supplementary Fig. 8). Based on these findings, we roughly deduced the structure of Ru nanozymes (Ru900 and Ru1000). As shown in Fig. 2k, Ru nanocrystals are firmly anchored on the N-doped carbon substrate, and a portion of Ru atoms coordinate with nitrogen and carbon.
Catalytic activities of RuX nanozymes
Similar to the active site distribution of natural metalloproteases with metal-amino acid coordination, transition metal-containing nanozymes often exhibit diverse enzymatic activities resembling those redox enzymes23,54,55,56. Here, we evaluated the enzyme-like activities of RuX, namely POD, OXD, CAT, and GSHOx activities, under weakly acidic pH condition that mimics the TME (Fig. 3a). RuX can be stably dispersed in aqueous solution within 10 days with negligible changes in hydrodynamic diameter and zeta potential (Supplementary Fig. 9), ensuring their stable catalysis. We detected the POD-like activity of RuX using 3,3′,5,5′-tetramethylbenzidine (TMB) as the probe and H2O2 as the substrate. The colorless TMB can be oxidized into blue oxTMB by •OH generated during the reaction57,58,59. As a result, control sample NC1000 without Ru nanocrystals exhibited negligible POD-like activity, while Ru800 with low Ru loading showed weak catalytic activity (Fig. 3b and Supplementary Fig. 10, Supplementary Table 1). In contrast, both Ru900 and Ru1000 demonstrated significantly higher POD-like activity, with Ru1000 exhibiting superior activity compared to Ru900 despite possessing similar Ru loading. This enhancement may be attributed to the lattice expansion of Ru nanocrystals in Ru1000. Additionally, we observed OXD-like activity in RuX, where O2 was catalyzed to generate •O2− in the absence of H2O2. Among the RuX samples, Ru1000 displayed the highest catalytic efficiency in generating •O2− (Fig. 3c). The catalytic generation of •OH and •O2− was further confirmed through electron spin resonance (ESR) measurement, as evident from the characteristic 1:2:2:1 four-line signals of •OH and the 1:1:1:1 four-line signals of •O2− after capturing with 5,5-dimethyl-1-pyrroline-N-oxide (DMPO) (Fig. 3d, e). To intuitively observe the effect of lattice expansion on the rate of •OH generation catalyzed by RuX, we used time-dependent in situ ESR to monitor the generation process of •OH. Under the premise that the test conditions were completely consistent, Ru1000 exhibited the highest reaction rate to generate •OH during the initial 120 s (Supplementary Fig. 11).

a Schematic diagram of the catalytic reaction catalyzed by RuX. b Measurement of •OH generation through POD-like activity using TMB as a probe. c Measurement of •O2− generation through OXD-like activity using TMB as a probe. EPR spectra of (d) •OH and (e) •O2− trapped by 5,5-dimethyl-1-pyrroline-N-oxide (DMPO) at pH 6.5. f CAT-like activity of RuX decomposing H2O2 to produce O2. g GSHOx-like activity under various conditions. h Structural and optical photograph (inset) of VCS-TENG. i Output of VCS-TENG at different voltages. j Measurement of POD-like activity of RuX under electrical stimulation provided by VCS-TENG. k Measurement of OXD-like activity of RuX under electrical stimulation provided by VCS-TENG. Source data are provided as a Source Data file.
Moreover, we investigated the CAT-like and GSHOx-like activities of RuX (Fig. 3f, g). Consistently, Ru1000 demonstrated the highest enzyme-like activities. The O2 produced through CAT-like activity can not only alleviate the hypoxic state in tumor tissues but also serve as a substate for producing toxic •O2− through the OXD-like activity of RuX. The GSHOx-like activities of RuX can destroy the intracellular antioxidant defense, amplifying oxidative damage. The mass spectrum (MS) verified the formation of the oxidation product oxidized glutathione (GSSH) and GSH was almost consumed at the 10th min (Supplementary Fig. 12). The cascade catalysis mediated by the four enzyme-like activities of RuX might cause a ROS storm that can finally boost cancer cell killing.
Subsequently, we investigated the steady-state kinetic process of RuX using Michaelis-Menten kinetics and Lineweaver-Burk plots (Supplementary Fig. 13 and Supplementary Fig. 14). The Michaelis constant (KM) and the maximum velocity (vmax) of Ru1000 for the POD-like catalytic reaction were calculated as 18.4 mM and 1.16 × 10⁻⁶ M/s, respectively (Supplementary Table 6). Comparatively, the vmax of Ru1000 was 8.9 times higher than that of Ru800 and 1.15 times higher than that of Ru900, while the KM of Ru1000 was lower than that of Ru800 and Ru900. These findings indicated that Ru1000 exhibited the highest affinity towards the substrate H2O2, effectively enhancing the generation rate of •OH. Similar results were observed in the kinetics of GSHOx-like catalytic reactions, where the vmax of Ru1000 was 3.11 and 1.23 times higher than Ru800 and Ru900, respectively (Supplementary Table 7). Based on these results, we deduced that lattice expansion in Ru nanocrystals positively regulated the catalytic activity of RuX.
In our previous studies, we demonstrated that the catalytic activity of nanozymes, including those supported on N-doped carbon, can be enhanced by self-driven electrical stimulation39,40,41. Building upon these findings, we further investigated whether self-driven electrical stimulation can also enhance the catalytic activities of RuX. To deliver the electrical stimulation, we fabricated a lightweight and wearable vertical contact-separation mode triboelectric nanogenerator (VCS-TENG) as a self-sustaining power source. The VCS-TENG was constructed using commonly used dielectric polytetrafluoroethylene film and copper-nickel alloy electrode with fabric rough structure for improving the contacting area and output performance (Fig. 3h). The resultant device can be manipulated by grasping and pressing with one hand, and the principle was shown in Supplementary Fig. 15a, b. Under reciprocating hand motion, VCS-TENG converts mechanical energy into electrical energy and generates alternating current. Specifically, when the VCS-TENG was pressed under a frequency of ~3 Hz, the open-circuit voltage (Voc) reached about 40 V, the short-circuit current (Isc) was ~3 µA, and the transferred charge was about 50 nC (Supplementary Fig. 15c–e). By applying different mechanical forces, the output Voc can be adjusted within the range of 10–50 V (Fig. 3i). The output remained almost constant when the frequency was varied in the range of 1–4 Hz (Supplementary Fig. 15f). Even after ~4200 friction cycles within 1400 s, the Voc value remained stable, indicating excellent stability of the VCS-TENG (Supplementary Fig. 15g). When the matching resistance was 20 MΩ, the maximum power generated by the VCS-TENG reached 81.9 µW (Supplementary Fig. 15h, i), providing a robust and biosafe electrical stimulation source.
We investigated the impact of electrical stimulation provided by VCS-TENG on the catalytic activities of RuX. First, we noticed that the POD-like activity of Ru1000 changed with the voltages and frequencies of the VCS-TENG and the pH values of the reaction media (Supplementary Fig. 16). Ru1000 exhibited optimal catalytic activity at a voltage of 50 V and a frequency of 3 Hz, so we selected this electrical stimulation parameter for subsequent exploration, and denoted this parameter as “E” if not otherwise specified. The results indicated that the application of electrical stimulation significantly improved the four distinct enzyme-like activities of all the RuX samples and ROS generation (Fig. 3j, k and Supplementary Fig. 17). Importantly, Ru1000 exhibited the most remarkable responsiveness to the electrical stimulation in regard to the catalytic efficiency. Compared to that without electrical stimulation, the POD-like catalytic efficiency of Ru1000 increased by 43.3%. In contrast, Ru800 and Ru900 only increased by 20% and 24.3%, respectively. We speculated that the lattice expansion in Ru nanocrystals enhanced the electro-responsiveness of RuX. This hypothesis was supported by additional experiments involving terephthalic acid and methylene blue as the probes, which demonstrated that Ru1000 displayed the highest capability to generate •OH and •O2− among all samples tested, and the electrical stimulation provided by VCS-TENG further improved the performance (Supplementary Fig. 17a, b). The ESR results confirmed that electrical stimulation efficiently promoted the generation of •OH and •O2− by Ru1000 (Supplementary Fig. 17c, d). In addition, the CAT-like and GSHOx-like activities of RuX also exhibited similar trend of electro-responsiveness (Supplementary Fig. 17e, f). We also explored its catalytic activities in cell culture media supplied with fetal bovine serum to simulate the actual cell growth environment. The results demonstrated that the Ru-based nanozymes can still maintain excellent four enzyme-like activities and electroresponsiveness, which had a consistent trend with the results detected in the phosphate buffered saline (PBS) (Supplementary Fig. 18). It suggested that the nanocatalysts can stably exert catalytic performance in various environments. We also used the same method to prepare copper-based nanozymes with different lattice spacings and found a similar phenomenon, that is, lattice expansion promotes the catalytic activity and electrical responsiveness of the copper-based nanozymes (Supplementary Fig. 22). We will continue our research in our subsequent work.
Mechanism of lattice expansion and electrical stimulation promoted catalysis
To elucidate the mechanism underlying the enhanced catalytic activities of Ru nanozymes induced by lattice expansion and electrical stimulation, we conducted DFT calculations. Figure 4a, b depicts the key intermediate structures and Gibbs free energy diagrams along the optimized reaction pathways for the H2O2 to •OH conversion, representative of the POD-like activity of RuX. Initially, H2O2 molecules adsorb onto the active sites of the Ru nanocrystals. The adsorption energies on Ru800, Ru900 and Ru1000 are +0.13 eV, +0.1 eV, and −0.5 eV, respectively. For Ru800 and Ru900, the adsorption of H2O2 is the rate-limiting step due to the higher lattice density and electron density, which impairs its ability to adsorb H2O2. In contrast, the adsorption of H2O2 on Ru1000 is thermodynamically spontaneous without requiring additional energy. When an electric field is applied, the adsorption energies on the surface of Ru800, Ru900, and Ru1000 all decrease, with the reduction of 0.14 eV, 0.27 eV, and 0.4 eV for Ru800, Ru900, and Ru1000, respectively. The corresponding free energy calculation results show that the order of adsorption difficulty of H2O2 on the RuX surface is Ru800 (most difficult)

a Proposed catalytic mechanism for POD-like reaction on RuX. b Corresponding free energy diagram for POD-like catalytic reaction on RuX under different conditions. DOS of Ru800 without electrical stimulation (c) and with electrical stimulation (d). DOS of Ru900 without electrical stimulation (e) and with electrical stimulation (f). DOS of Ru1000 without electrical stimulation (g) and with electrical stimulation (h). Source data are provided as a Source Data file.
We conducted a comparison of the projected electronic densities of states between Ru800, Ru900, and Ru1000. Relative to Ru800 and Ru900, the d-band center of Ru1000 shifts closer to the Fermi level, resulting in a greater occupation of electrons near the Fermi energy level (Fig. 4c–h). Furthermore, under electrical stimulation, the d-band center of Ru1000 moves even closer to the Fermi level. These findings suggest that lattice expansion and electrical stimulation promote the transfer of active electrons during the catalytic process, facilitating the catalytic •OH generation. Additionally, Supplementary Fig. 23 illustrates the adsorption energy of OH on the Ru nanocrystals. The calculated OH adsorption energies on Ru900, Ru900+E, Ru1000, and Ru1000+E are −0.90, −1.10, −1.38, and −1.63 eV, respectively. These results indicate that both lattice expansion and electrical stimulation enhance the Ru-OH bonding, favoring subsequent proton coupling reaction and accelerating the overall catalytic reaction.
We used in situ Raman spectroscopy to provide additional evidence for the fragmentation pathway of H2O2. Under the premise that the test conditions of the three samples were completely consistent, the intensity of the peak at 3491 cm−1 from the stretching vibration of O-H in *H2O was strongest for Ru1000 and weakest for Ru800 (Supplementary Fig. 24). This was consistent with the step diagram results in DFT, indicating that the lattice expansion was conducive to accelerating the cracking process of H2O2 during the catalytic reaction, ultimately promoting the generation of •OH. Subsequently, we used cyclic voltammetry (CV) and electrochemical impedance spectroscopy to reveal the electron transfer process during the catalytic redox reaction of RuX and H2O2. Compared with Ru800 and Ru900, the current increase of Ru1000 were most significant, and prominent redox peaks appeared at bias voltages of −0.4 V and 0.2 V, which were attributed to the redox reaction from H2O2 (Supplementary Fig. 25a). Interestingly, the current was further enhanced under the electrical stimulation provided by the VCS-TENG. The catalytic activity of Ru1000 was improved by the highest level under the electrical stimulation, followed by Ru900. Supplementary Fig. 25b displayed the Nyquist plots of Ru800, Ru900, and Ru1000 electrodes measured after supplying H2O2. The Nyquist curves of Ru900 and Ru1000 consisted of high-frequency curves and low-frequency linear parts, indicating that their redox reactions were dominated by charge transfer and diffusion processes. The high-frequency intercept can be partially attributed to charge transfer at the electrolyte/electrode interface. The charge transfer resistance obtained from the arc radius showed that Ru1000 had the lowest charge transfer resistance, and the redox reaction catalyzed by Ru1000 was easier. These results verified that the lattice expansion optimizes the first step of the redox reaction, that is, the adsorption of substrate H2O2 on the active site occurs more easily. Subsequently, it cooperates with external electrical stimulation to enhance the Ru-OH bonding, which is beneficial to the subsequent proton coupling reaction and accelerates the entire catalytic reaction.
In vitro cancer therapy with Ru nanozymes
Encouraged by the capability of RuX to catalyze ROS generation and deplete GSH, we investigated their potential for killing cancer cells under electrical stimulation provided by the VCS-TENG (Fig. 5a). Initially, we evaluated the cytotoxicity of RuX on 4T1 cells using the 3-[4,5-dimethylthiazol-2-yl]-2,5-diphenyltetrazolium bromide (MTT) assay (Fig. 5b). Considering the overproduction of H2O2 within tumors in vivo, H2O2 (100 μM) was supplied to the cell culture medium to mimic the TME condition, which had no significant negative effect on cell viability (H2O2 group in Fig. 5b). As a result, the cell viability of the Ru1000 group (200 μg/mL of Ru1000) was found to be the lowest (36.25%) compared to the Ru800 and Ru900 groups. We also investigated the impact of electrical stimulation provided by VCS-TENG on cell viability. Applying electrical stimulation alone had no adverse effect on cell viability (E group in Fig. 5b). The cell viability of the Ru1000 + E group was the lowest, reaching 23.25%. Therefore, it can be concluded that Ru1000 exhibited the highest capacity for killing cancer cells, particularly under electrical stimulation. In addition, the cytotoxicity of Ru1000 was found to be concentration- and pH- dependent. The highest level of cell cytotoxicity was achieved at a Ru1000 concentration of 200 μg/mL, in weakly acidic culture medium of pH 6.5, and with electrical stimulation applied (Fig. 5c). In contrast, after the treatment with 800 μg/mL of Ru1000, the cell viability of normal mouse L929 fibroblasts was still higher than 65%, and there was no significant increase in toxicity after applying electrical stimulation (Fig. 5d). This indicated that Ru1000 and self-driven electricity had high biosafety when using for cancer therapy.

a Schematic illustration of RuX killing tumor cells via enzyme-like cascade reactions. b Viability of 4T1 cells under different conditions. Data are presented as mean values ± SD (n = 5 independent experiments). 4T1: murine mammary carcinoma cell line. c Viability of 4T1 cells after different treatments with Ru1000. Data are presented as mean values ± SD (n = 5 independent experiments). d Viability of L929 cells after treatment with different concentrations of Ru1000 with/without electrical stimulation. Data are presented as mean values ± SD (n = 5 independent experiments). L929: mouse fibroblast cell line. e Laser confocal images and (f) green/red fluorescence (FL) ratio of 4T1 cells stained with Calcein-AM (live cells: green) and propidium iodide (dead cells: red) after various treatments. g Laser confocal images of intracellular ROS level stained with DCFH-DA in 4T1 cells and h corresponding quantitative data of intracellular ROS levels. Data are presented as mean values ± SD. i JC-1 stained laser confocal image and (j) green/red FL ratios of 4T1 cells. k GSH/GSSG ratio in 4T1 cells before and after treatment with of Ru1000 (200 μg mL−1) and Ru1000 + E. Data are presented as mean values ± SD (n = 3 independent experiments). In (e, g, i) the experiments were repeated independently three times with similar results, and a representative result is shown for each. Source data are provided as a Source Data file.
The anticancer efficacy of RuX was directly observed using live/dead cell staining with Calcein acetoxymethyl ester (Calcein-AM) and propidium iodide following various treatments (Supplementary Fig. 26). The percentages of viable cells in the E, Ru800, Ru900, and Ru1000 groups were determined to be 97.8%, 81.8%, 42.6%, and 32.4%, respectively. Notably, only 18.5% of cells remained viable in the Ru1000 + E group, indicating that Ru1000 demonstrated the highest cancer cell-killing potency when combined with electrical stimulation (Fig. 5e, f). To gain further insight into the cytotoxicity of RuX, intracellular ROS levels were assessed using 2′,7′-dichlorodihydrofluorescein diacetate as a probe (Supplementary Fig. 27). The fluorescence increased in the Ru800, Ru900, Ru1000, and Ru1000 + E groups compared to the control group, confirming the ability of RuX to catalyze abundant ROS generation within the cells (Fig. 5g, h). Particularly, the Ru1000 + E group exhibited the strongest green fluorescence, indicating that Ru1000 can enhance ROS production under electrical stimulation, consequently leading to cellular oxidative damage and subsequent cell death. Moreover, mitochondrial membrane potential, indicative of mitochondrial damage, was visualized using 5,5′,6,6′-tetrachloro-1,1′,3,3′-tetraethylimidacarbocyanine iodide (JC-1) as a probe (Supplementary Fig. 28). As a result, the Ru1000 treated 4T1 cells exhibited prominent green fluorescence, which was further intensified in the Ru1000 + E group (Fig. 5i, j). These findings confirmed the severe oxidative damage to mitochondria induced by Ru1000 under electrical stimulation. This damage was attributed to the excessive production of ROS and the reduced antioxidative capacity of the cells, which can further activate the mitochondrial apoptotic pathway within the cells. Subsequently, GSH/GSSH detection kit was used to quantitatively determine the intracellular GSH contents. The GSH/GSSG molar ratio in intact 4T1 cells was ~5.13, while after treatment with 200 μg mL−1 Ru1000 for 12 h, the ratio dropped to ~1.78 and further to ~1.25 after additional electrical stimulation (Fig. 5k). It demonstrated that Ru1000 can eliminate GSH in cancer cells and destroy the antioxidant barrier and aggravate oxidative stress.
Acute toxicity of Ru1000 in mice
Based on the catalytic efficiency of RuX in vitro and at the cellular level, Ru1000 that exhibited the optimal therapeutic performance and high cytocompatibility was selected for further in vivo investigation. Prior to exploring its antitumor activity in vivo, a comprehensive assessment of systemic acute toxicity was conducted to demonstrate its biosafety. The result of hemolysis assay demonstrated that Ru1000 had a low hemolysis rate at a concentration high up to 800 μg/mL, suggesting high hemocompatibility (Supplementary Fig. 29). The acute toxicity test was conducted by administering different doses of Ru1000 (0, 50, 100, and 200 mg/kg) into female BALB/c mice via intravenous injection. Over a 14-days observation period, no abnormal clinical signs were observed in any of the mice, and the body weight changes in the treatment groups followed a pattern similar to that of the control group (Supplementary Fig. 30).
Fourteen days after the intravenous injection, blood biochemistry tests revealed that hepatic and renal function markers, including alanine aminotransferase, aspartate aminotransferase, blood urea nitrogen, and creatinine, showed no abnormal changes in the mice injected with Ru1000 compared to the control group (Supplementary Fig. 31a). Furthermore, the blood routine test revealed that white blood cell, red blood cell, hemoglobin, mean corpuscular volume, mean corpuscular hemoglobin, mean corpuscular hemoglobin concentration, hematocrit, and platelets remained within normal ranges across various doses of Ru1000 (Supplementary Fig. 31b). Finally, hematoxylin and eosin (H&E) staining of major organs, including the heart, liver, spleen, lungs, and kidneys in all mice, revealed no histological abnormalities, confirming the excellent biocompatibility of Ru1000 (Supplementary Fig. 31c).
In vivo cancer therapy with Ru1000
Encouraged by the excellent tumor killing in vitro, a subcutaneous 4T1 tumor-bearing BALB/c mice were employed to evaluate the in vivo anticancer effect of Ru1000. The tumor-bearing mice were randomly divided into four groups (n = 6): (1) control group: receiving local injection of PBS; 2) E group: exposed to electrical stimulation generated by VCS-TENG, which was manipulated by an experimental operator; 3) Ru1000 group: locally injected with 5 mg/kg Ru1000; 4) Ru1000 + E group: receiving local injection of 5 mg/kg Ru1000 followed by electrical stimulation using VCS-TENG. During the 14-day treatment period, the mice received a single Ru1000 administration on day 0, followed by a single electrical stimulation after 6 h (Fig. 6a). Analysis of the tumor growth curves during the treatment revealed rapid tumor growth in the E group, with no significant difference compared to the control group (Fig. 6b, c). Notably, the Ru1000 group exhibited obvious tumor suppression, attributed to the excellent catalytic activity of Ru1000. More importantly, the Ru1000 + E group demonstrated the highest tumor suppression effect, suggesting that the electrical stimulation provided by VCS-TENG efficiently enhanced the therapeutic efficacy of Ru1000. At the end of the treatment, the tumor suppression rates were calculated as 61% and 82% in the Ru1000 and Ru1000 + E groups, respectively, based on the tumor weights (Fig. 6d, e).

a Schematic representation depicting the treatment procedure of 4T1 tumor mice by local injection of Ru1000 and electrical stimulation provided by VCS-TENG. b Individual tumor growth curves of the mice after various treatments. c Tumor growth curves of mice subjected to various treatments. Data are presented as mean values ± SD (n = 6 independent experiments). d Average weight of tumors after 14 days of treatments. Data are presented as mean values ± SD (n = 6 independent experiments). e Optical photograph displaying the excised tumors on day 14. f H&E and Ki-67 staining of tumor sections from different groups. Source data are provided as a Source Data file.
Throughout the treatment, there were no significant differences in the changes of body weight among all mice, indicating the high biological safety of the treatment method (Supplementary Fig. 32). Pathological examination through H&E staining revealed that the residual tumor tissues in the Ru1000 + E group exhibited the largest area of tumor necrosis (Fig. 6f). Furthermore, immunohistochemical staining of Ki−67, a key marker associated with active cancer cell proliferation, displayed a similar trend (Fig. 6f). Additionally, H&E staining of major organs including the heart, liver, spleen, lungs, and kidneys showed no apparent abnormalities or inflammation (Supplementary Fig. 33). These results confirmed the excellent catalytic activity and electro-responsiveness of Ru1000 for effective cancer therapy with good biosafety.