Synthesis and characterization of the Ru1Co-SAA catalyst
To prepare Ru1Co-SAA and RunCo-NA (Fig. 1), Ru1CoAl- and RunCoAl-LDH nanosheets were firstly synthesized as catalyst precursors using the same one-pot hydrothermal method as CoAl-LDH reported in our previous work8. The Ru/Co molar ratios in the precursors and catalysts were measured by inductively coupled plasma-optical emission spectroscopy (ICP-OES, Supplementary Table 1). Powder X-ray diffraction (XRD) results showed that the crystallinity of LDH precursors decreased with increasing Ru loading (Supplementary Fig. 1). Hydrogen temperature-programmed reduction (H2-TPR, Supplementary Fig. 2) profiles guided the selection of temperature to reduce the LDH precursors to obtain the Co-NP, Ru1Co-SAA and RunCo-NA catalysts. To ensure that all the cobalt in the precursors was reduced to metallic Co nanoparticles, the LDH precursors were then heated at 650 °C for 5 h in a H2/N2 (10/90) atmosphere.

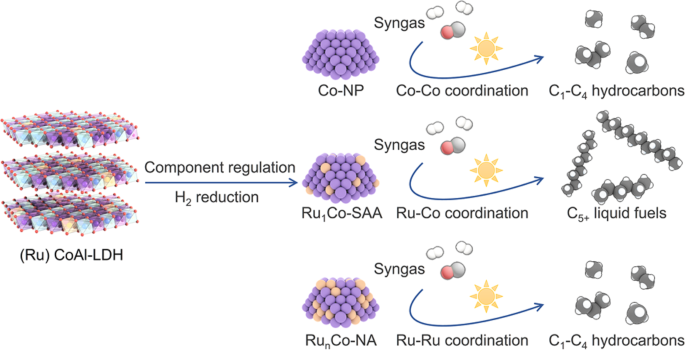
The left illustration shows the structure of LDH precursors. The middle illustration shows nanostructures of active nanoparticles in Co-NP, Ru1Co-SAA and RunCo-NA catalysts derived from LDHs. The right illustration shows that Ru1Co-SAA contributes to C5+ liquid fuels owing to the dominant Ru-Co coordination while Co-NP and RunCo-NA lead to C1-C4 hydrocarbons due to the pure Co-Co coordination and partial Ru-Ru coordination, respectively.
The crystallinity of the as-obtained catalysts was studied by powder XRD (Supplementary Fig. 3). The XRD patterns for each sample contained dominant diffraction peaks at around 52° and 61°, corresponding to the (111) and (200) planes of fcc metallic Co. No diffraction peaks due to Ru or RuO2 were observed in the XRD patterns of either Ru1Co-SAA or RunCo-NA, indicating that all Ru species were highly dispersed in these materials. Further structural analysis of the catalysts (Supplementary Fig. 4 and Table 2) revealed that Ru1Co-SAA, RunCo-NA and Co-NP catalysts possessed generally similar structures (primarily metallic Co nanoparticles supported on 2D amorphous alumina sheets). High-resolution transmission electron microscopy (HRTEM) images revealed that the Co nanoparticles in Ru1Co-SAA possessed an average diameter of 9.8 ± 1.8 nm (Fig. 2a and Supplementary Fig. 5). High-angle annular dark-field scanning transmission electron microscopy (HAADF-STEM) images and energy-dispersive spectroscopy (EDS) element maps (Fig. 2b, c) further confirmed the highly uniform dispersion of Co nanoparticles on amorphous alumina sheets with no Ru nanoparticles present. The lattice fringe spacing on the metal nanoparticles in Ru1Co-SAA was 0.20 nm (Fig. 2d), in good accord with the lattice spacing of Co (111). Aberration-corrected high-angle annular dark-field scanning transmission electron microscopy (AC-HAADF-STEM) was able to distinguish single Ru atoms from Co atoms due to differences in the Z-contrast of these elements39,40,41,42. Figure 2e verified the uniform dispersion of isolated bright Ru atoms in the Co nanoparticles. Furthermore, Fig. 2f, g showed that the single Ru atoms took the place of Co atoms in the lattice. The X-Y line profile over a metal nanoparticle in Ru1Co-SAA (Fig. 2h) conclusively proved the presence of Ru atoms in the Co metal lattice, with the Ru atoms having stronger intensity (the 4th and 7th atoms in nine consecutive atoms marked from Fig. 2f)43,44. The diameters of Co nanoparticles in the control catalysts (Co-NP and RunCo-NA, Supplementary Figs. 6–7) were similar to those in the Ru1Co-SAA catalyst, though the distribution of Ru in RunCo-NA was quite different to Ru1Co-SAA. For RunCo-NA, the higher Ru content resulted in a higher Ru coverage on the surface of the Co nanoparticles (Supplementary Fig. 7). A line scan across two adjacent nanoparticles showed that the signals for Ru and Co overlapped, evidence for the formation of a binary RuCo nanoalloy.

a HRTEM image of Ru1Co-SAA at low magnification. Scale bar, 50 nm. b HAADF-STEM image of the Ru1Co-SAA catalyst. Scale bar, 50 nm. c EDS element maps for Co, Ru, Al and O in the dotted-box area. Scale bar, 10 nm. d HRTEM image of Ru1Co-SAA at high magnification. Scale bar, 5 nm. e AC-HAADF-STEM image of Ru1Co-SAA at low magnification. Scale bar, 5 nm. f, g AC-HAADF-STEM image and its color-coded intensity map of Ru1Co-SAA at atomic-resolution high magnification. Scale bar, 1 nm. h X-Y line profile for Ru and Co atoms, measured from f.
Ru K-edge and Co K-edge X-ray absorption spectroscopy (XAS) was next performed to further probe the local structure of the metal nanoparticles in Ru1Co-SAA and RunCo-NA. As shown in Fig. 3a, the Ru K-edge near-edge features of Ru1Co-SAA and RunCo-NA were similar to those of the Ru reference foil, confirming the presence of metallic Ru in the Co nanoparticles. Further analysis in Supplementary Fig. 8 indicated the average oxidation state of Ru in Ru1Co-SAA and RunCo-NA were +0.6 and +1.3, respectively, indicating intra-atomic charge re-distribution in the alloy catalysts. Fourier-transformed k2-weighted extended X-ray absorption fine structure (EXAFS) in R-space allowed elucidation of the coordination environments of Ru atoms in the Co nanoparticles (Fig. 3b). For Ru1Co-SAA, a peak at 2.0 Å was observed and assigned to a Ru-Co scattering path (first coordination shell). This feature was conspicuously shorter than the first Ru-Ru coordination shell feature in Ru foil (2.4 Å)39,45. No peaks corresponding to the Ru-Ru scattering were observed for Ru1Co-SAA, confirming the dominant Ru-Co coordination (i.e. isolated Ru atoms) in the catalyst. In contrast, a distinct shoulder peak at 2.4 Å due to the Ru-Ru scattering was observed for RunCo-NA. Together with the a weaker Ru-Co coordination than Ru1Co-SAA, this indicated the presence of Ru clusters in the RuCo alloy nanoparticles of RunCo-NA. Wavelet transformed EXAFS (WT-EXAFS) Ru K-edge spectra in k-space and R-space further revealed the distinct differences between Ru1Co-SAA and RunCo-NA. Ru1Co-SAA showed one intensity maximum at the wavenumber 6.5 Å−1 in the contour plot (Fig. 3c). In contrast, RunCo-NA showed another intensity maximum at 9.4 Å−1, corresponding to the Ru-Ru region (Supplementary Fig. 9). The Co K-edge XAS data (Supplementary Fig. 10) for the Ru1Co-SAA, RunCo-NA and Co-NP catalysts were similar, revealing a dominant Co-Co scattering path similar to the metallic Co reference foil (evidence for the presence of Co0 nanoparticles rather than oxide phases).

a Ru K-edge XANES for Ru1Co-SAA and RunCo-NA. b EXAFS spectra in R-space for Ru1Co-SAA and RunCo-NA. c WT analysis of Ru1Co-SAA. d EXAFS fitting curves in R-space for Ru1Co-SAA. e The optimized structure of Ru1Co-SAA. Color code: Ru (orange), Co (violet).
Quantitative chemical configuration analysis of Ru1Co-SAA and RunCo-NA were carried out through the least-squared EXAFS fitting. The R-space fitting was performed to estimate the coordination environment of Ru atoms in the first shell (Fig. 3d, Supplementary Fig. 11, and Supplementary Table 3). For Ru1Co-SAA, the Ru atoms had an average coordination number of 8.9 and a mean bond length of 2.53 Å between the center Ru atom and surrounding Co atoms. For RunCo-NA, the Ru-Co coordination number was lower (5.4), whilst the Ru-Ru coordination number was 2.6, demonstrating the existence of metallic Ru-Ru bond (likely as Ru clusters) in RunCo-NA. The curve-fits in k and q space revealed a high accuracy of fitting (Supplementary Fig. 12). In the optimized DFT structure for Ru1Co-SAA (Fig. 3e), the Ru-Co bond length (2.53 Å) was the same as that determined from the EXAFS fitting, similar to that of Co-Co bond length due to the confinement effect of the fcc Co lattice31,32. Furthermore, the results of EXAFS analysis and atomic-resolution AC-HAADF-STEM images for the Ru1Co-SAA catalyst were highly consistent, confirming the uniform incorporation of single Ru atoms in the alumina-supported Co nanoparticles.
CO photo-hydrogenation performance under ambient pressures
CO photo-hydrogenation tests were carried out in a flow-type system (see Methods for experimental details) to investigate the impact of the RuCo atomic structure on the catalytic performance. The Co-NP, Ru1Co-SAA and RunCo-NA catalysts were all black colored and exhibited strong light absorption across the UV-Vis region (Supplementary Fig. 13). This enabled each catalyst to efficiently convert the photon energy into local heating for driving CO hydrogenation reactions without requiring external heating sources. Under UV-Vis irradiation at a light intensity of 1.80 W cm−2, the temperature of Ru1Co-SAA catalyst surface rapidly increased to reach 200 °C within 15 min (Supplementary Fig. 14). In order to investigate the photo-hydrogenation activity of catalysts in the flow-type reaction chamber (CO/H2/N2 = 20/40/40, the gas hourly space velocity, GHSV = 2400 mL g−1 h−1, 0.1 MPa), the CO conversion was measured at temperature ranging from 170-220 °C (Supplementary Fig. 15). In the measured temperature range, Ru1Co-SAA maintained the highest CO conversion amongst the catalysts tested (8.7% at 170 °C to 57.7% at 220 °C). Figure 4a shows apparent activation energies for CO conversion over Co-NP, Ru1Co-SAA and RunCo-NA were 88.64, 75.64, and 83.99 kJ mol−1, respectively. Results demonstrate that Ru1Co-SAA catalyst had the best activity to drive CO photo-hydrogenation. The C-C coupling of intermediates is an essential process to obtain long-chain liquid fuels in CO hydrogenation. Of particular interest in this context is the C5+ selectivity. For the Co-NP catalyst, the CO conversion at 200 °C with atmospheric-pressure syngas was only 17.7%. The main products were C1-4 hydrocarbons (68.7% selectivity) and some C5+ hydrocarbons (29.5% selectivity), as shown in Fig. 4b and Supplementary Table 4. By introducing the Ru single atom into Co nanoparticles, the C5+ selectivity was greatly improved. For Ru1Co-SAA, the CO conversion reached 31.8% with a C5+ selectivity as high as 60.2%, representing truly outstanding FTS performance under ambient pressure (0.1 MPa). Although RunCo-NA showed enhanced CO photo-hydrogenation performance compared to the Co-NP catalyst, the promoting effect of Ru was far less pronounced than the Ru1Co-SAA catalyst. Results suggest that the Ru-Co coordination in Ru1Co-SAA was critical for achieving a high C5+ selectivity at low pressures. In addition, the temperature-selectivity relationship for Ru1Co-SAA was explored (Supplementary Fig. 16), with a temperature of 200 °C offering the best overall performance in terms of CO conversion with good C5+ selectivity. Next, CO photo-hydrogenation experiments at 0.3 and 0.5 MPa were carried out. With the elevation of syngas pressure, the CO conversion over Ru1Co-SAA increased to 58.6%, with a TOF of 0.114 s−1 and a C5+ selectivity of 75.8%. It should be noted that the CO photo-hydrogenation performance of Ru1Co-SAA at 0.5 MPa was comparable to best Co-based, Ru-based and RuCo-alloy catalysts operated at much higher pressures (normally above 2 MPa). As illustrated in Fig. 4c and Supplementary Table 5, the performance of Ru1Co-SAA ranks superior to all FTS catalysts reported to date when considering six crucial FTS reaction parameters (temperature, pressure, TOF, C5+ selectivity, CO2 selectivity and chain growth probability α). In particular, Ru1Co-SAA exhibited the special advantages of a high TOF, high C5+ selectivity and low operating pressure8,9,10,11,12,13,14,15,16,17. Gas chromatograph (GC) profiles of the gaseous and liquid products formed during CO photo-hydrogenation over Ru1Co-SAA are shown in Supplementary Figs. 17, 18. The specific product distributions at various pressures conformed to Anderson-Schulz-Flory (ASF) distributions (Fig. 4d). The α value at reaction pressure of 0.1, 0.3 and 0.5 MPa were determined to be 0.75, 0.78 and 0.81, respectively, indicating that the C-C coupling ability of the Ru1Co-SAA catalyst improved as the syngas pressure increased. The comparative thermo-catalytic experiment using only electric heating was performed over Ru1Co-SAA, illustrating that the CO photo-hydrogenation followed a photothermal reaction mechanism (Supplementary Fig. 19). The stability of the Ru1Co-SAA catalyst was next investigated, with steady CO photo-hydrogenation tests showing no obvious performance losses over 100 h of continuous operation (Fig. 4e). XRD and HADDF-STEM results showed that the structure of the Ru1Co-SAA catalyst was unchanged following the stability test (Supplementary Figs. 20, 21).

a Arrhenius plot for CO conversion activity over Co-NP, Ru1Co-SAA and RunCo-NA. b CO photo-hydrogenation performance of Co-NP, Ru1Co-SAA and RunCo-NA (reaction conditions: 50 mg catalyst, 1.80 W cm−2 UV-Vis irradiation for 10 h, T = 200 °C, CO/H2/N2 (20/40/40) as feed gas, GHSV = 2400 mL g−1 h−1). c Comparison of FTS performance of Ru1Co-SAA with other state-of-the-art Co-based, Ru-based and RuCo-alloyed catalysts. P pressure, T temperature, α ASF chain growth probability, Sel selectivity, TOF turnover frequency. d The hydrocarbon product distribution obtained over Ru1Co-SAA under UV-Vis irradiation. e Durability test on Ru1Co-SAA under 1.80 W cm−2 UV-Vis irradiation.
In order to better understand the catalytic properties of the Co-NP, Ru1Co-SAA and RunCo-NA catalysts, temperature programmed desorption (TPD) measurements were performed. CO-TPD profiles (Supplementary Fig. 22) were collected at a heating rate of 10 °C min−1 following CO pre-adsorption at room temperature. The total amounts of adsorbed CO on the Co-NP, Ru1Co-SAA and RunCo-NA catalysts were 2.47, 5.71 and 4.68 mmol g−1 respectively, indicating that the addition of Ru significantly enhanced the CO adsorption properties of the Co nanoparticles. The CO desorption peaks at high temperatures originate from the recombinative desorption of surface C* and O* species adsorbed on the metal sites, signifying the strong chemisorption of CO on Ru1Co-SAA13. The H2-TPD profiles (Supplementary Fig. 23) showed that H2 adsorption on Ru1Co-SAA and Co-NP were very similar, indicating that the single atom Ru sites did not alter the H2 adsorption feature of the Co nanoparticles. In contrast, both physical and chemical adsorption of H2 were promoted by RuCo alloy nanoparticles in RunCo-NA. Results demonstrate the addition of atomically dispersed Ru enhanced the chemisorption of CO whilst having negligible impact on H2 adsorption.
In addition to the surface adsorption of reactants (CO and H2), their dissociation on active sites is also an important consideration for efficient CO photo-hydrogenation. To explore this aspect, we conducted pulse chemisorption experiments using both CO pulses and H2/D2 pulses to evaluate the dissociation ability of the catalyst for CO and H2, respectively (with the schematic mechanism shown in Supplementary Fig. 24). All experiments were conducted at 200 °C and ambient pressure (0.1 MPa). Results of the CO pulse experiments are shown in Fig. 5a, which evaluated the ability of the catalysts to activate CO and form C* and O* species on the catalyst surface. The Ru1Co-SAA catalyst performed the strongest CO2 signal (m/z = 44), indicating that C* and O* species were formed in high coverage from the dissociation of CO46. Accordingly, amongst the catalyst studied, Ru1Co-SAA offered the best ability for CO conversion. Combining the results of CO-TPD and CO pulse experiments, it can be concluded that the strong interaction between CO and active Ru1Co-SAA metal sites (resulting in a long residence time of C* species on the catalyst surface) would promote C-C coupling of CHx* intermediates13,47. The HD signals (m/z = 3) arising from the H2/D2 pulse provided valuable information about the hydrogen activation ability of the different catalysts. An excessively high hydrogen activation ability is considered detrimental to the carbon chain growth into C5+ liquid fuels in FTS. As shown in Fig. 5b, Ru1Co-SAA exhibited a similar HD signal (m/z = 3, representing the hydrogen dissociation ability) to Co-NP, whereas RunCo-NA showed the strongest HD signal compared to the other catalysts. The strong hydrogen dissociation ability of RunCo-NA would lead to the over-hydrogenation of CHx* intermediates and limit long-chain hydrocarbon growth through C-C coupling reactions22. The chemisorption studies demonstrate that atomically dispersed Ru sites in Co nanoparticles enhance the formation of surface C* species without affecting the activation of H2, this benefitting C-C coupling reactions and preventing the over-hydrogenation of CHx* intermediates.

a CO pulse profile with CO (m/z = 28) and CO2 (m/z = 44) signals. b H2 isotopic pulse profile with H2 (m/z = 2), D2 (m/z = 4) and HD (m/z = 3) signals.
DFT studies of CO dissociation, hydrogenation and C-C coupling of CHx* intermediates
To better understand the mechanism by which Ru single atoms promoted CO activation and enhanced long-chain hydrocarbon production, DFT calculations were carried out. The calculation details are provided in the Methods section, with the simulation models shown in Supplementary Fig. 25. According to previous studies, the CO activation via H-assistant path (CO* + H* → HCO* → CH* + O*) is more favorable than direct CO dissociation and other H-assistant pathways5,48. Figure 6a shows that the CO adsorption strengths were −2.19 eV on Co (111), −2.34 eV on Ru1Co (111), and −2.32 eV on RunCo (111). The rate determining step in CO activation is the hydrogenation of CO* to form HCO* (CO* + H* → HCO*). The energy barriers (Ea) for this step were similar on the Co (111) and RunCo (111) surfaces were 1.32 eV and 1.39 eV, respectively, whilst a much lower energy barrier (1.17 eV) existed on the Ru1Co (111) surface. From a thermodynamics viewpoint, the H-assistant dissociation of CO* on the Co (111), Ru1Co (111) and RunCo (111) surfaces were exothermic processes, releasing reaction energies (Er) of −1.85 eV, −2.05 eV, and −1.87 eV, respectively. Therefore, in terms of both kinetics and thermodynamics, CO* dissociation was more favorable on the Ru1Co (111) surface compared to the other surfaces. This is consistent with the higher CO conversion over the Ru1Co-SAA catalyst by experiment. For the further hydrogenation of CHx* intermediates, the Ru1Co (111) surface showed similar properties to the Co (111) surface comprehensively considering thermodynamics and kinetics for the steps from CH* to CH4 (CH* + 3H* → CH2* + 2H* → CH3* + H* → CH4, see Supplementary Fig. 26 and Supplementary Tables 6–8 for details). In contrast, the RunCo (111) surface showed lower Ea and Er values compared with the other two catalyst models in almost every step from CH* to CH4, demonstrating that Ru-Ru coordination environments in RunCo-NA caused over-hydrogenation of CHx* intermediates.

a Potential energy profile of CO* dissociation. b Potential energy profile of eight C-C coupling paths for C2* intermediates. c Correlation analysis between the unsaturation of C2* intermediates relative to ethane (Ω) and the energy barrier reduction (∆Ea) of Ru1Co-SAA minus Co-NP. d Linear correlation between unsaturation of C2* intermediates relative to ethane (Ω) and energy barrier reduction (∆Ea) of Ru1Co-SAA minus Co-NP. e Proposed products from intermediates with different unsaturation over Ru1Co-SAA and RunCo-NA through CO photo-hydrogenation at ambient pressures.
For C-C coupling reactions on the three surface models, eight possible paths for producing C2* intermediates were considered (Fig. 6b and Supplementary Fig. 27). The Ea and Er values for these different paths were summarized in Supplementary Tables 9–11. For five paths (in which C2* species of CC*, CCH*, CCH2*, CHCH* and CHCH2* were generated), the Ru1Co (111) surface offered the lowest C-C coupling Ea (Supplementary Fig. 28). For two paths (those leading to CHCH* and CCH3*), the Ru1Co (111) surface offered the lowest C-C coupling Er. Considering that the CO photo-hydrogenation tests in the current work were performed at ambient and near ambient pressures, Ea is the main metric of interest since there was no requirement to apply high pressures to overcome the C-C coupling energy barriers (as is often the case in thermal FTS reactions to higher liquid hydrocarbons). In comparison, the RunCo (111) surface offered the second lowest Ea in five C-C coupling paths (leading to CC*, CCH*, CCH2*, CHCH2*, and CHCH3*), whilst the Co (111) surface had the highest Ea in four C-C coupling paths (leading to CC*, CCH*, CCH2*, and CHCH2*). The low Ea values for C-C coupling reactions on the model Ru1Co (111) surface suggested that Ru-Co site coordination possessed higher intrinsic C-C coupling ability compared to Co-Co and Ru-Ru coordination environments.