
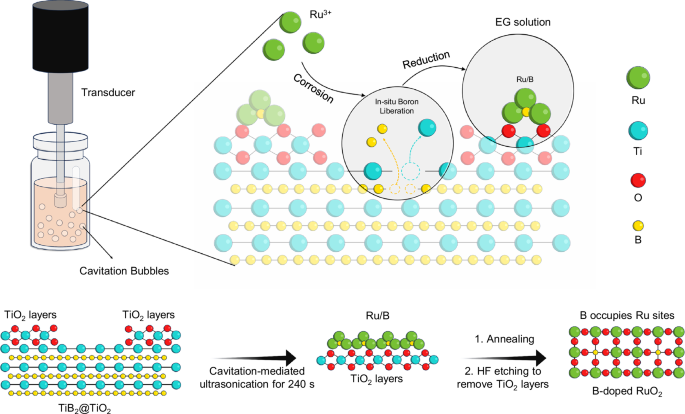
Cavitation-mediated sonochemical synthesis of B-RuO2
Cavitation erosion is defined as material degradation on a solid surface caused by the formation, growth and subsequent rupture of a large number of bubbles in a liquid33. It has long been recognized as a damaging phenomenon in hydraulic systems (e.g., pump impellers, turbine blades)34,35. We propose to repurpose this traditionally detrimental mechanism into a synthesis strategy: harnessing cavitation-induced microjetting to (1) selectively erode solid boron precursors and (2) generate reactive boron species for atomic-level dopant incorporation. This paradigm shift from destructive failure to constructive materials engineering presents a distinct synthesis pathway, though the fundamental mechanisms governing cavitation-enabled doping remain underexplored.
The acoustic cavitation effect induced by high-intensity ultrasonic irradiation (24 kHz, 1000 W cm−2) exhibits a dual mechanism of action: in the bulk liquid phase, cavitation bubbles collapse in a spherically symmetric manner, generating transient high-temperature (≈5000 °C) and high-pressure (~1000 atm) hotspots; while at the solid-liquid interface, cavitation bubbles exhibit asymmetric collapse characteristics, generating high-speed microjets (>100 m s−1) and shockwaves36,37. These combined mechanical-thermodynamic effects induce interfacial material fatigue damage. Leveraging this principle, we apply ultrasonic cavitation erosion to an ethylene glycol reduction system containing TiB2@TiO2 nanoparticles and Ru3+ ions: cavitation-induced microjets preferentially erode TiB2@TiO2 nanoparticles to release reactive boron species, while the transient thermal field significantly reduces the diffusion barrier for boron atoms within nascent metallic Ru lattices, enabling efficient solid-state boron doping kinetics. This coupling is difficult to achieve under conventional solvothermally or oil-bath conditions, where the same precursor chemistry instead leads to incomplete precursor conversion, phase separation, and severe Ru aggregation.
Scanning electron microscopy (SEM), transmission electron microscopy (TEM), high-angle annular dark-field-scanning transmission electron microscopy (HAADF-STEM), and energy-dispersive X-ray spectroscopy (EDS) elemental mapping were employed to investigate the synthetic process. As characterized in Supplementary Fig. 1, the pristine TiB2@TiO2 precursor exhibits a distinct core-shell architecture, where the TiB2 core is encapsulated by a native TiO2 passivation layer, evidenced by surface Ti/O enrichment. During the initial 120 s of ultrasonic irradiation (Supplementary Fig. 2a, b), these particles undergo progressive fragmentation, evolving into numerous irregular flake-like nanostructures. As shown in the elemental mapping (Supplementary Fig. 2c, d), the Ru and B species exhibit significant spatial aggregation, while Ti and O species are distinctively colocalized in separate regions, indicating an initial tendency toward phase separation between the newly formed B-Ru species and the TiO2 support.
With extended ultrasonic processing (180 and 240 s), this structural reconstruction ultimately results in the formation of 2D microporous meshes comprising ultrafine B-Ru nanowires (diameter = ~2 nm) anchored on a residual TiO2 layer (Supplementary Figs. 3 and 4a–d). The X-ray diffraction (XRD) analysis confirmed the emergence of metallic Ru phases and the disappearance of TiB2 peaks, indicating the complete decomposition of the boron precursor (Fig. 2a). Supplementary Fig. 4e confirms the presence of a thin TiO2 layer underlying the 2D B-Ru mesh architecture, with a lattice interspacing of 0.356 nm at the heterointerface corresponding to the (101) planes of anatase TiO2. Supplementary Fig. 4f illustrates that the in-situ decomposition of TiB2 generates residual TiO2 overlayers that function as heterogeneous nucleation templates, providing sites for Ru nucleation and enabling the subsequent growth of B-Ru nanoparticles (B-Ru/TiO2). The granular morphology of the B-Ru nanowires implies that the transient high-temperature/pressure conditions (which accelerate atomic diffusion) facilitate the oriented attachment of ultrafine B-Ru nanoparticle precursors into short nanowires, followed by their atomic fusion and interconnection into a 2D mesh-like architecture38,39.

a XRD patterns of samples corresponding to each stage of the synthetic process. b Aberration-corrected STEM images of B-RuO2. c HAADF-STEM images of B-RuO2. d STEM–EELS spectrum results corresponding to B-RuO2. e EDS elemental mapping images of Ru, B, O in B-RuO2. The green, yellow and red elemental maps correspond to Ru, B, and O, respectively. f EPMA-WDS images of the distribution of Ru and B elements for B-RuO2. The rainbow-color scale indicates the relative Ru or B signal intensity/concentration in the EPMA-WDS maps. Source data for Fig. 2a, d are provided as a Source data file.
Elemental mapping of the TiB2@TiO2 following 240 s of ultrasonic treatment demonstrates a distinct phase separation: Ru and B are homogeneously co-distributed throughout the matrix, while Ti and O exhibit spatial co-localization in the substrate (Supplementary Fig. 5). This spatial decoupling between (Ru/B) and (Ti/O) phases demonstrates two concurrent processes: (1) preservation of residual TiO2 domains from the decomposition of TiB2@TiO2, and (2) boron migration into the Ru lattice through transient thermal activation. Notably, the comparative experiments demonstrated that the erosion of TiB2 nanoparticles occurs exclusively in the presence of Ru3+ ions (Supplementary Figs. 6 and 7), suggesting a synergistic effect between physical cavitation and chemical corrosion on the successful release of boron and its subsequent doping into the Ru lattice. In summary, ultrasonically induced microjets, combined with Ru3+-driven etching, initially crack and corrode the TiB2@TiO2 nanoparticles, liberating reactive boron species while preserving the residual TiO2 scaffold, while subsequent bubble-collapse thermal shocks promote rapid boron diffusion into nascent metallic Ru domains. Consequently, after 240 s of ultrasonic treatment, we obtained the B-Ru/TiO2 sample.
Subsequent air-annealing and hydrofluoric acid (HF) treatments transformed the B-Ru/TiO2 meshes into pure rutile B-RuO2 nanoflakes, while completely removing the TiO2 layer. For comparison, a RuO2 control sample (denoted as RuO2) was prepared following the same procedure but without the addition of TiB2 as the boron source. X-ray photoelectron spectroscopy (XPS) confirms the complete removal of titanium, showing only the Ru 3p peak at 462.6 eV with no detectable Ti 2p signal (Supplementary Fig. 8). XRD analysis confirms the crystalline structure of B-RuO2, showing characteristic peaks consistent with the rutile phase of RuO2 (Fig. 2a). STEM reveals a lattice spacing of approximately 0.319 nm for the (110) plane in B-RuO2, indicating boron incorporation without significant structural distortion (Fig. 2b). The HAADF-STEM, TEM, and atomic force microscopy (AFM) images (Fig. 2c, Supplementary Figs. 9 and 10) reveal that the B-RuO2 nanoflakes are composed of numerous interconnected nanosheets with a thickness of approximately 1.2 nm. In contrast, although the RuO2 control also crystallizes in the rutile phase, TEM and elemental mapping show that it consists of severely aggregated particles rather than the interconnected ultrathin nanoflake network observed for B-RuO2 (Supplementary Fig. 11). This comparison indicates that TiB2 serves not only as the boron source, but also plays an essential role in regulating the transient nucleation and structural evolution of the Ru-based phase under cavitation conditions. Brunauer–Emmett–Teller specific surface area measurement (Supplementary Fig. 12 and Supplementary Table 1) confirms that the cavitation-induced decomposition generates hierarchically porous B-RuO2 nanoflakes with a higher specific surface area (27.0 m2 g−1) than that of RuO2 (11.9 m2 g−1), thereby increasing the exposure of active sites and enhancing catalytic efficiency. The synthesis of the optimized B-RuO2 catalysts was carried out under conditions involving the addition of 35 mg of TiB2 followed by annealing at a temperature of 350 °C for a duration of 3 h, resulting in the final B-RuO2 catalysts with the highest OER activity and stability (Supplementary Fig. 13).
To directly verify the role of the sonochemical route, we carried out control experiments using the same precursor system (RuCl3·xH2O + TiB2 in ethylene glycol), but replacing ultrasound with solvothermal treatment or oil-bath heating at 160 °C40. Two representative durations were examined: 4 min, which matches the actual sonochemical reaction time, and 3 h, which is sufficiently long for substantial TiB2 corrosion under conventional thermal conditions according to previous reports40. At 4 min, neither solvothermal nor oil-bath treatment induced effective Ru reduction or TiB2 corrosion; the precursor retained its original morphology, and only TiB2 diffraction was observed (Supplementary Figs. 14 and 15). Even after 3 h, both conventional routes still failed to produce a homogeneous boron-doped Ru-based product. Instead, metallic Ru was clearly detected by XRD (Supplementary Fig. 16a, d), while TEM and elemental mapping revealed inhomogeneous Ru-containing structures, including TiO2-supported shell-like Ru domains and large agglomerated Ru particles (Supplementary Fig. 16b, c, e, f). After the same subsequent annealing and HF treatment steps, residual metallic Ru diffraction peaks were still present (Supplementary Fig. 17a, d), indicating incomplete oxidation of the Ru phase. Correspondingly, elemental mapping showed that oxygen was mainly distributed at the particle surface (Supplementary Fig. 17b, c, e, f), consistent with insufficient oxidation of the large Ru aggregates. Furthermore, boron species are not observed in the B 1s XPS spectra of the RuO2 derived from either solvothermal or oil bath treatments (Supplementary Fig. 18), indicating that these conventional routes failed to achieve boron incorporation into rutile RuO2. As a result, the final catalysts exhibited much poorer acidic OER activity than the sonochemically synthesized B-RuO2 (Supplementary Fig. 19). These results demonstrate that the cavitation-mediated microenvironment is not merely a faster heating process, but a qualitatively different reaction field that synchronizes TiB2 corrosion, Ru3+ reduction, nucleation, and boron incorporation within a few minutes.
To further evaluate the practical potential of this sonochemical strategy, we carried out preliminary scale-up experiments by increasing the reaction volume from 7 mL (i.e., B-RuO2) to 20, 50, and 100 mL, with the resulting products denoted as B-RuO2–20 mL, B-RuO2−50 mL, and B-RuO2−100 mL, respectively, while correspondingly adjusting the sonication time (Supplementary Table 2). The scaled-up products retained highly consistent phase structure, morphology, and elemental distribution (Supplementary Fig. 20), indicating that the cavitation-mediated formation process is reproducible beyond the small-batch condition. Importantly, the 100 mL sample still delivered high activity together with similar stability behavior (Supplementary Fig. 21), demonstrating that the synthetic advantages of this route can be maintained upon scale-up. Quantitative analysis further showed that the Ru reduction efficiency remained above 99.70%, and that only a very small amount of Ru was lost during the subsequent HF treatment step (Supplementary Table 3). The practical mass yield increased markedly with increasing batch size (Supplementary Table 2), indicating that the lower yield at small scale mainly originates from handling losses during washing, centrifugation, and collection rather than from incomplete Ru conversion or substantial Ru dissolution. These results highlight that the present sonochemical route is not only rapid and structurally effective, but also chemically efficient and practically scalable.
The composition of B-RuO2, particularly the boron content and distribution, was rigorously characterized by electron energy loss spectroscopy (EELS) (Fig. 2d), EDS elemental mapping (Fig. 2e), and electron probe X-ray micro-analyzer coupled with wavelength-dispersive X-ray spectroscopy (EPMA-WDS) (Fig. 2f) and Ar-ion sputtering XPS depth profiling (Supplementary Figs. 22 and 23). Because B-RuO2 consists of ultrathin nanoflakes with a thickness of only ~1.2 nm (Supplementary Fig. 10), bulk doping in this system refers to boron distributed through the full nanoflake thickness, and XPS can probe a substantial fraction of the nanoflake interior. EDS mapping (Fig. 2e) shows clear co-localization of Ru, O, and B across the nanoflakes, while the B 1s signal at 191.2 eV remains clearly observable after sputtering to depths of 4 and 8 nm, confirming that boron is not restricted to the outermost surface (Supplementary Fig. 22). XPS depth-profile in the Ti 2p/Ru 3p region further shows only the Ru 3p3/2 signal, without any detectable Ti-related contribution after HF treatment, even after sputtering to deeper regions (Supplementary Fig. 23), thereby ruling out residual or substitutional Ti in the final catalyst. EPMA-WDS, prioritized for its high sensitivity to light elements, confirmed a Ru/B atomic ratio of 91.6:8.4 (Supplementary Table 4), effectively circumventing the limitations of EDS (severe B Kα/Bremsstrahlung overlap) and XPS (poor B 1s signal-to-noise ratio), ensuring reliable quantification even at low boron concentrations. To note, the spatial intensity variation in the EPMA-WDS maps mainly reflects micrometer-scale differences in aggregate stacking rather than boron segregation (Fig. 2f). Collectively, these structural and compositional analyses demonstrate that the cavitation-mediated sonochemical strategy successfully overcomes thermodynamic barriers to achieve uniform, bulk doping of boron into the RuO2 lattice.
Substitutional boron doping modulates electronic structures
To further identify the lattice occupancy of boron, we combined Ru K-edge wavelet-transformed extended X-ray absorption fine structure (WT-EXAFS) and solid-state 11B magic-angle-spinning nuclear magnetic resonance (11B MAS NMR). The Ru K-edge WT-EXAFS result provides site-specific evidence for substitutional incorporation (Fig. 3a, b). In B-RuO2, the first-shell Ru-O scattering feature remains nearly identical to that of RuO2 in both R space and k space, indicating that the basic RuO6 framework of rutile RuO2 is largely preserved. In contrast, the second-shell Ru-Ru scattering feature is distinctly modified, particularly around k ≈ 10 Å−1 and R + ΔR ≈ 3 Å. This selective perturbation of the cation–cation correlation is consistent with partial replacement of Ru-O-Ru motifs by Ru-O-B motifs, because boron is a much lighter scatterer than ruthenium and therefore changes the second-shell backscattering behavior much more strongly than the first-shell Ru-O feature. If boron were incorporated primarily at interstitial sites, the Ru sublattice would remain largely intact, and such a distinct modification of the Ru-Ru second-shell correlation would be much less likely. Therefore, the WT-EXAFS result strongly favors substitution of boron at Ru lattice sites rather than simple interstitial incorporation.

WT-EXAFS spectra collected at the Ru K-edge of RuO2 (a) and B-RuO2 (b). R denotes radial distance, and k denotes the photoelectron wavenumber. c 11B MAS NMR spectrum of B-RuO2. d High-resolution XPS spectra of Ru 3d calibrated with the C 1s peak (284.8 eV). Normalized XANES spectra collected at Ru K-edge with the magnified image presented in the inset (e), valence state fitting based on the Ru K-edge absorption energy (E0) (f) and Fourier-transformed Ru K-edge EXAFS in R space (g) of B-RuO2, RuO2 and Ru foil. Raman spectra (h) and O K-edge SXAS spectra (i) of B-RuO2 and RuO2. The spectra are presented with only baseline correction for visual comparison, with no normalization or other correction performed. Source data are provided as a Source data file.
The solid-state 11B MAS NMR spectrum provides an independent boron-centered view of the local environment. B-RuO2 exhibits a single very broad and clearly asymmetric resonance centered at 8.6 ppm, with a large full width at half maximum (FWHM) of approximately 82.9 ppm (Fig. 3c). By contrast, the Na2B4O7 reference shows a sharp dominant resonance near 0 ppm together with two much weaker peaks at around 12 and 16 ppm, corresponding to well-defined borate environments (Supplementary Fig. 24). This comparison first excludes the possibility that the boron signal in B-RuO2 originates from a crystalline borate-like impurity phase, because such phases would give narrow and well-resolved resonances rather than the broad envelope observed here. More importantly, the unusually large FWHM and pronounced asymmetry indicate that boron does not occupy a simple and well-defined local site, but instead resides in a strongly distorted and highly distributed set of B-O-Ru environments within the RuO2 lattice41. This behavior is expected for aliovalent substitution of the much smaller B species onto Ru sites, which necessarily introduces strong local structural relaxation, local symmetry breaking, and a broad distribution of electric-field gradients. By contrast, interstitial boron would be expected to reside in a comparatively more regular local cavity environment and would generally produce a much narrower and more symmetric 11B resonance42,43. Together with the XPS depth profile results described above, these observations support that boron is incorporated predominantly through homogeneous substitution at Ru lattice sites rather than through interstitial doping.
To elucidate the influence of substitutional boron incorporation on the electronic configuration and local coordination environment of the catalyst, we conducted systematic investigations using XPS and X-ray absorption spectroscopy (XAS). In the Ru 3d and Ru 3p XPS spectra (Fig. 3d and Supplementary Fig. 25), B-RuO2 exhibits binding energy peaks at 280.9 eV (Ru 3d5/2) and 462.6 eV (Ru 3p3/2), respectively. In comparison, RuO2 shows the binding energy peaks at 281.0 eV (Ru 3d5/2) and 462.9 eV (Ru 3p3/2). These shifts suggest a slightly reduced average Ru oxidation state in B-RuO2. This is further corroborated by Ru K-edge X-ray absorption near edge structure (XANES) spectra (Fig. 3e and Supplementary Fig. 26), where the energy of the absorption edge of B-RuO2 is shifted by ~0.2 eV to lower energy than that of RuO2. Using Ru foil, RuCl3, and RuO2 as references, the average Ru oxidation state of B-RuO2 is semi-quantitatively estimated to be 3.91 (Fig. 3f), consistent with partial electron redistribution induced by boron incorporation21.
Fourier-transformed EXAFS (FT-EXAFS) analysis (Fig. 3g) at the Ru K-edge reveals two key differences in the B-RuO2 compared to RuO2. Firstly, the dominant peak at 1.48 Å, corresponding to the first-shell Ru-O coordination, shows a markedly attenuated intensity compared to that of RuO2 (1.46 Å), suggesting a lower Ru-O coordination number44,45. Secondly, this peak of the B-RuO2 shows a radial distance shift of +0.02 Å, suggesting an elongation of the Ru-O bond length in B-RuO2. This bond elongation is further supported by Raman spectroscopy. The Eg and A1g peaks of Ru-O bond vibrations in B-RuO2 exhibit red-shifts of 8.4 and 23.2 cm−1, respectively, relative to the RuO2 peaks at 509.5 cm−1 (Eg) and 628.0 cm−1 (A1g) (Fig. 3h)46,47. These results indicate that substitutional boron incorporation induces severe local structural distortion that affects the Ru-O bonding.
O K-edge soft X-ray absorption spectroscopy (SXAS) provides further insight into the bonding nature (Fig. 3i)48. Direct comparison of the baseline-corrected spectra shows that both the t2g and eg pre-edge features decrease in B-RuO2 relative to RuO2, with a more pronounced suppression of the t2g component49. This result indicates that the O K-edge change cannot be interpreted simply by the t2g/eg, intensity ratio alone. Instead, it reflects a combined effect of reduced overall Ru 4d-O 2p hybridization associated with the elongated Ru-O bond, increased occupation of the lower-energy t2g-derived states due to partial Ru reduction, and local symmetry lowering induced by substitutional boron incorporation50,51. Thus, substitutional boron doping modulates both the local geometry and the electronic structure of Ru sites in rutile RuO2, leading to a modified Ru-O bonding environment with reduced overall hybridization. We note that the slightly enhanced intensity above ~535 eV may include contributions from the overall oxygen-related absorption background and B-O related local coordination environments; therefore, this high-energy feature is not used as the primary basis for assigning reduced Ru 4d-O 2p hybridization. Mechanistically, the boron-induced weakening of Ru-O hybridization is expected to suppress the LOM pathway and thereby improve structural stability, while also favoring oxygen-intermediate adsorption along the AEM pathway, thus contributing to the enhanced intrinsic OER kinetics of B-RuO213,49.
B-RuO2 drives active and durable OER
The OER performance of B-RuO2 was systematically evaluated in 0.1 M HClO4 using a standard three-electrode setup. For comparison, RuO2 and commercial RuO2 (denoted as Com-RuO2) were also tested under the same experimental conditions. Ninety percent iR corrected linear sweep voltammetry (LSV) curves (Supplementary Fig. 27a and Fig. 4a) reveal that B-RuO2 delivers a current density of 10 mA cm−2 at an overpotential (η) of 180 mV, significantly lower than RuO2 (253 mV) and Com-RuO2 (279 mV). This enhancement is further evidenced by the Tafel slope analysis (Supplementary Fig. 27b), where B-RuO2 exhibits a much smaller slope (35.23 mV dec−1) compared to RuO2 (55.80 mV dec−1) and Com-RuO2 (57.50 mV dec−1), indicating remarkably accelerated kinetics. In addition, electrochemical impedance spectroscopy (EIS) reveals a markedly lower charge transfer resistance (Rct) for B-RuO2 compared to RuO2 and Com-RuO2 (Supplementary Fig. 27c), demonstrating that boron doping effectively facilitates interfacial electron transfer kinetics.

a LSV curves for B-RuO2, RuO2, and Com-RuO2 at 5 mV s−1 in 0.1 M HClO4 electrolyte with 90% iR correction. The solution resistance used for iR correction was 25.0 Ω, measured from the high-frequency intercept of the EIS Nyquist plot. b Comparison of six performance metrics among B-RuO2, RuO2, and Com-RuO2, including overpotential at 10 mA cm−2, Tafel slope, Cdl, EIS, TOF, and MA at overpotential of 200 mV. The light-blue area is the background, and the red, cyan and dark-blue column shadings denote B-RuO2, RuO2, and Com-RuO2, respectively. c Chronopotentiometry tests in 0.1 M HClO4 electrolyte at 10 mA cm−2, with the catalyst loaded on gas diffusion layer (GDL) at a loading of 2 mg cm−2. d E–t curves of B-RuO2 and RuO2 catalysts in a PEMWE at a current density of 200 mA cm−2 and 1 A cm−2. All tests were conducted at 60 °C with commercial Pt/C as the cathode catalyst. Nafion 117 membrane was employed as the proton exchange membrane, and no iR compensation was applied to the cell voltages. Electrochemical measurements in (a–c) were performed in O2-saturated 0.1 M HClO4 (pH = 1) at ~25 °C. For a, b, measurements were conducted in a three-electrode cell using a glassy carbon rotating disk electrode with a catalyst loading of 0.38 mg cm−2, a scan rate of 5 mV s−1 and 1600 r.p.m. rotation. For c, chronopotentiometry was conducted in an H-cell using a gas diffusion layer electrode with a catalyst loading of 2 mg cm−2. PEMWE measurements in (d) were performed in a two-electrode MEA configuration at 60 °C using 0.1 M HClO4 (pH = 1) at a flow rate of 0.9 mL min−1, with an anode catalyst loading of 2 mgcat cm−2 and a cathode Pt loading of 0.2 mgPt cm−2. Source data are provided as a Source data file.
To investigate the source of the intrinsic activity of B-RuO2 catalysts, double-layer capacitance (Cdl) measurements were first performed to estimate the electrochemical surface area (ECSA) (Supplementary Fig. 28). B-RuO2 displays the highest Cdl value (8.08 mF, Supplementary Fig. 29a), corresponding to an ECSA 5.1-fold larger than that of RuO2. This increased surface area is attributed to the hierarchical porosity of the B-RuO2 nanoflakes, which maximizes active site exposure. Critically, however, ECSA-normalized LSV curves (Supplementary Fig. 29b) reveal that B-RuO2 still delivers the highest activity among the three samples, underscoring its enhanced intrinsic activity. To further quantify the density of electrochemically accessible redox-active surface sites, pulse voltammetry-based surface charge storage measurements were performed (Supplementary Fig. 30a–c)52,53. B-RuO2 exhibits a fitted capacitance of 55.7 mF, much higher than that of RuO2 (8.4 mF) (Supplementary Fig. 30d). This 5.6-fold increase is in agreement with the 5.1-fold enhancement obtained from the Cdl-derived ECSA, confirming that B-RuO2 exposes a much larger population of electrochemically accessible active sites. The turnover frequency (TOF) and mass activity (MA) were further calculated to quantify the active-site efficiency. At η = 200 mV, B-RuO2 achieves a TOF of 149.02 h−1 (vs. 6.00 h−1 for RuO2) and an MA of 142.39 A gRu−1 (vs. 6.34 A gRu−1 for RuO2) (Supplementary Fig. 31). These order-of-magnitude improvements highlight the critical role of boron in activating Ru sites. As summarized in the radar plot of six key performance metrics (Fig. 4b and Supplementary Table 5), B-RuO2 demonstrates competitive performance.
To clarify whether the HF treatment affects the catalytic performance through fluorine incorporation, we carried out several control experiments (Supplementary Fig. 32). The intermediate B-RuO2/TiO2 sample before HF etching shows clearly inferior OER activity to the final B-RuO2 (Supplementary Fig. 33a), confirming that HF treatment is necessary to fully expose the catalyst. However, B-RuO2 samples prepared under different HF concentrations and etching times exhibit nearly identical activity (Supplementary Fig. 33b, c), and no detectable F 1s XPS signal is observed after etching (Supplementary Fig. 33d). Moreover, the same HF treatment does not improve the activity of the RuO2 control sample (Supplementary Fig. 34). Therefore, the beneficial effect of HF treatment originates from removal of the inactive TiO2 template rather than fluorine doping. Taken together, we conclude that the high activity arises not merely from increased active site density, but also from the boron-induced modification of the Ru-O bonding environment, evidenced by XPS, XANES, Raman, and O K-edge SXAS.
The stability of the B-RuO2 catalyst in an acid environment is a crucial parameter for its practical applications. Galvanostatic chronopotentiometry (CP) at 10 mA cm−2 (Fig. 4c) demonstrates long-term stability for B-RuO2, with a negligible potential increase rate of 27.3 μV h−1 over 3000 h. In contrast, both RuO2 and Com-RuO2 suffer rapid failure within dozens of hours. To quantitatively benchmark this stability, we calculated the S-number metric; the S-number for B-RuO2 reaches 1.53 × 10⁷, which is on the same order of magnitude as that of crystalline IrO2 (Supplementary Fig. 35)54. A comprehensive comparison with recently reported doped RuO2 OER catalysts (Supplementary Fig. 36a and Supplementary Table 6) positions B-RuO2 as a competitive catalyst, addressing the activity-stability trade-off by achieving a low overpotential (η = 180 mV@10 mA cm−2) and long-term stability (>3000 h@10 mA cm−2). Notably, compared with previously reported B-doped RuO2 prepared by conventional routes55,56,57,58, the present sonochemical strategy combines competitive activity, longer durability, and a rapid 4 min synthesis step. This advantage is directly supported by our solvothermal- and oil-bath-derived control samples, which show much poorer OER activity than sonochemically synthesized B-RuO2 (Supplementary Fig. 19).
To assess the practical applicability, the B-RuO2 catalysts were evaluated in a PEM water electrolyzer at 60 °C using 0.1 M HClO4 as the electrolyte (Supplementary Figs. 37 and 38a). The I–V polarization curve (Supplementary Fig. 38b) shows that the PEMWE achieves 1 A cm−2 at 1.714 V, showing competitive performance relative to commercial benchmarks. Corroborating this high activity, the measured oxygen Faradaic efficiency remains near 100% across various current densities (Supplementary Fig. 39), confirming that the recorded current derives exclusively from water oxidation rather than catalyst corrosion. Furthermore, the E–t curve at 200 mA cm−2 demonstrates high stability for B-RuO2 with over 2000 h of continuous operation with a negligible voltage degradation rate of 20 μV h−1 (Fig. 4d). This differs from the Com-RuO2 benchmark, which fails rapidly within less than 20 h under identical conditions. More significantly, even under the industrial-grade current density of 1 A cm−2, B-RuO2 maintains robust stability for over 200 h, exhibiting a low decay rate of only 65.0 μV h−1. This stability in a practical PEM electrolyzer is competitive among reported doped Ru-based systems, supporting the substantial stabilization effect of B doping (Supplementary Fig. 36b and Supplementary Table 7). Beyond performance metrics, the economic feasibility of the B-RuO2-based PEMWE was assessed. The calculated energy consumption at 1 A cm−2 is only 45.97 kW h kg−1 H2, which is lower than that of commercially reported PEMWEs (50.00–55.56 kW h kg−1 H2). The estimated hydrogen production cost of this PEMWE is $0.92 per kilogram of H2, which is below the U.S. Department of Energy’s target of $1.00 per kilogram of H2 by 2030. This further confirms the practical application potential of B-RuO2 catalysts. Collectively, the combination of long-term durability, high energy efficiency, and low hydrogen production cost supports the practical application potential of B-RuO2 catalysts for next-generation green hydrogen technologies.
Robust B-O bonding stabilizes Ru active sites
To elucidate the stabilizing mechanism of boron dopants, we first investigate the chemical state and structure of boron in the pristine B-RuO2 using XPS, boron K-edge SXAS, and Raman spectroscopy. Prior to OER, the Raman spectrum of B-RuO2 reveals a broad peak at 789.4 cm−1 corresponding to B-O bond vibrations (Fig. 3h)59. The B 1s XPS depth profiling corroborates this finding, showing a characteristic B-O bonding peak (B3+) at 191.2 eV (Supplementary Figs. 22 and 40a)60. Furthermore, the B K-edge SXAS (Fig. 5a) spectrum shows a dominant feature at 193.9 eV, assigned to trigonal BO3-like lattice B-O coordination, together with a broad high-energy envelope above ~196 eV that is consistent with mixed contributions from distorted BO4-like and BO3-like local coordination61,62. The weaker low-energy feature near 191.8 eV is attributed to surface-segregated boron species (B-B dimers)61,62. Together with the substitutional-doping evidence established above, this result indicates that boron is predominantly incorporated into a distorted lattice environment in pristine B-RuO2. The pronounced size mismatch between B and Ru, together with the slightly larger B-O electronegativity difference relative to Ru-O, is expected to induce strong local relaxation and modify the B-O bonding configuration around the substitutional boron centers. Theoretically, these surface-segregated boron species possess high surface energy and undercoordinated configurations, rendering them thermodynamically metastable and susceptible to rapid oxidative leaching. In stark contrast, the lattice incorporated boron dopants are rigidly confined within the rutile lattice, where the strong bonding strength and covalency of the B-O bonds effectively anchor the lattice oxygen, creating a high kinetic barrier against structural collapse.

a B K-edge SXAS spectra of B-RuO2 before and after 24 h of OER at 10 mA cm−2. The spectra are shown with baseline correction for visual comparison and are not edge-step normalized. The heights of the BO3-like lattice B-O peak and the estimated post-edge level, determined from the relatively flat region between 206 and 210 eV, are indicated. b Dissolution amounts of Ru and B at different reaction times during the CP at 10 mA cm−2 test. Distinct color regions correspond to different dissolution patterns of boron, which are the transient stage (pink), the stabilized stage (gray), and stabilized stage over an extended time scale (cyan). Chronopotentiometry tests were conducted in 0.1 M HClO4 (pH = 1) at 10 mA cm−2 using an H-cell and a gas diffusion layer electrode with a catalyst loading of 2 mg cm−2 at ~ 25 °C. c FTIR spectra of B-RuO2 samples under different treatments, including as-prepared B-RuO2, NH3 purged B-RuO2 (B-RuO2-NH3 purge), and NH3 purged B-RuO2 after 24 h-CP test at 10 mA cm−2 (B-RuO2-after OER-NH3 purge). d Schematic illustration of the limited outermost-layer boron leaching during OER-induced surface reconstruction. FT-EXAFS at the Ru K-edge in R space (e) and first-derivative XANES at the Ru K-edge (f) of as-prepared B-RuO2 and B-RuO2 after chronoamperometry at various voltages for 24 h. R denotes radial distance. Source data are provided as a Source data file.
During the OER, time-resolved inductively coupled plasma mass spectrometry (ICP-MS) was employed to probe the dynamic dissolution behavior of boron. The dissolution profile reveals a rapid but limited surface-reconstruction process: an initial transient stage within the first 20 s (corresponding to a rapid boron dissolution rate of ~298.35 μg h−1), followed by a passivated stage where boron dissolution becomes negligible (Fig. 5b and Supplementary Table 8). By contrast, Ru exhibits consistent, low-level quasi-linear dissolution kinetics (0.02 μg h−1) throughout the entire operation. This behavior indicates that the dissolved boron mainly originates from a small population of labile surface-exposed species rather than from continuous loss of lattice-incorporated boron. To explicitly verify the depletion of surface boron, we employed NH3 chemisorption Fourier-transformed infrared spectroscopy (FTIR), exploiting the selective Lewis acid-base interaction between NH3 and boron sites63,64. Control experiments on RuO2 confirm negligible NH3 adsorption at Ru/O sites (Supplementary Fig. 41a). For the NH3 purged B-RuO2 sample (denoted as B-RuO2-NH3 purge), pre-OER characterization reveals distinct spectral fingerprints at 1082.8 cm−1 (B-N stretching) and 3133.7 cm−1 (N-H stretching) (Fig. 5c). These spectral features match those observed in the B2O3 reference spectra (Supplementary Fig. 41b), confirming the presence of accessible boron sites on the catalyst surface. In contrast, post-OER analysis of the NH3 purged B-RuO2 (denoted as B-RuO2-after OER-NH3 purge) demonstrates a complete disappearance of these boron-associated vibrations. This supports that the outermost surface-exposed boron species are rapidly removed during the initial oxidative polarization, driving a surface reconstruction that generates a stable, boron-depleted outer layer which protects the underlying lattice from further corrosion.
Post-OER characterizations of the B-RuO2 after 24-h chronopotentiometry at 10 mA cm−2 (denoted as B-RuO2-after OER) reveal that most lattice B-O bonding (from subsurface to bulk) is retained after this initial reconstruction. First, EDS mapping confirms that boron remains distributed throughout the bulk phase of B-RuO2 after OER (Supplementary Fig. 42a). As expected, quantitative analysis by EPMA-WDS shows only a marginal decrease in the Ru/B atomic ratio from 91.6: 8.4 to 92.1: 7.9 after the OER (Supplementary Fig. 42b and Supplementary Table 4). This minor change aligns with the rapid but limited surface-reconstruction process, confirming that only the outermost surface-exposed boron is dissolved during the OER process. Crucially, spectroscopic analyses (B 1s XPS, Raman, and B K-edge SXAS) demonstrate that the strong covalent B-O bonds in the subsurface remain preserved. Specifically, B 1s XPS and Raman spectra of B-RuO2-after OER maintain the characteristic B-O bonds (Supplementary Figs. 40b and 43)47, confirming that subsurface B3+ substitution is retained. In the B K-edge SXAS spectra (Fig. 5a), the low-energy feature at 191.8 eV associated with the surface-segregated boron species is diminished after OER, whereas the dominant BO3-like lattice B-O feature at 193.9 eV remains clearly observable. A direct comparison of the baseline-corrected spectra shows that the absolute intensity of this B-O-related feature decreases slightly after OER, indicating that a minor loss of subsurface lattice B-O species cannot be excluded. Nevertheless, the comparison still shows that a substantial majority of the subsurface lattice B-O species remain after OER. Specifically, the peak-to-edge-step ratio increases from 2.7 in B-RuO2 to 4.6 in B-RuO2-after OER, consistent with preferential removal of the surface B-B-related component while retaining a substantial majority of the subsurface lattice B-O species. These results indicate that the catalyst reaches a reconstructed steady-state surface supported by a boron-stabilized subsurface framework, which explains why the OER performance does not decay to the level of undoped RuO2. This interpretation is further supported by the nearly overlapping first and tenth LSV curves (Supplementary Fig. 44a, b) and the minimal decrease in Cdl after OER, from 8.08 to 7.94 mF (Supplementary Fig. 44c, d), indicating that the catalyst rapidly reaches a stable reconstructed state without detectable performance decay. These results demonstrate that while the surface reconstructs, the lattice B-O bonding maintains structural integrity. This creates a functional “core-shell-like” architecture (Fig. 5d): a catalytically active, reconstructed surface stabilized by a robust subsurface framework anchored by strong B-O bonds.
Having identified this boron-stabilized subsurface configuration, we next employed a suite of characterization techniques to probe its operational stability. Combined XRD and TEM analyses confirmed the preservation of both the rutile crystal structure and nanosheet morphology (Supplementary Fig. 45). Ru K-edge FT-EXAFS analysis (Fig. 5e) demonstrated the stable behavior of the first-shell Ru-O coordination, as its corresponding peak remained unchanged at 1.49 Å after 24-h chronoamperometry tests across a range of potentials (1.3–1.7 V vs. Ag/AgCl, denoted as B-RuO2-1.3/1.5/1.7 V-24 h) (Supplementary Fig. 46). This stability also extended to the second-shell Ru-Ru coordination, as validated by WT-EXAFS analysis (Supplementary Fig. 47).
With the structural integrity confirmed, we then assessed the electronic structure stability of the Ru active sites using XANES and XPS. Ru K-edge XANES spectra (Fig. 5f and Supplementary Fig. 48) show no shift in either the absorption edge energy or the first-derivative peaks throughout the testing period, demonstrating the stability of the Ru oxidation state under elevated potentials. Similarly, O 1s XPS spectra (Supplementary Fig. 49a) show that the lattice oxygen was well-preserved. This was further corroborated by O K-edge SXAS spectra (Supplementary Fig. 49b), which show nearly unattenuated t2g and eg peaks, confirming the preservation of Ru-O covalency. Collectively, these findings uncover the fundamental origin of the enhanced durability: the subsurface boron dopants function as robust “lattice anchors.” By forming robust covalent B-O bonds, they effectively suppress the LOM pathway, the primary trigger for catalyst dissolution, thereby preserving the integrity of the Ru active sites even under harsh oxidative conditions.
Investigation of suppressed lattice oxygen participation and enhanced intrinsic activity
To gain complementary insight into the suppressed lattice oxygen participation and enhanced intrinsic activity, we combined pH-dependent OER measurements, density functional theory (DFT) calculations, 18O isotope-labeled operando differential electrochemical mass spectroscopy (DEMS) and in situ electrochemical FTIR. We first analyzed the pH dependence of the OER kinetics by plotting log(j) at 1.42 V vs. RHE as a function of pH (Fig. 6a, b, and Supplementary Fig. 50). B-RuO2 shows a much weaker pH dependence, with a fitted slope of only −0.176, whereas RuO2 shows a significantly larger slope of −0.393. This weaker proton-activity dependence is consistent with suppressed lattice oxygen participation and a more AEM-dominant reaction pathway on B-RuO249,65.

a LSV curves measured at different pH values for B-RuO2. The solution resistances used for iR correction were 1.6, 3.0, 8.0, and 16.0 Ω for pH = 0, 0.5, 1, and 1.5, respectively, each measured once from the high-frequency intercept of the EIS Nyquist plot. LSV measurements were performed in a three-electrode cell at ~25 °C using a gas diffusion layer electrode with a catalyst loading of 0.35 mg cm−2. b OER current density at 1.42 V vs. RHE plotted on a logarithmic scale as a function of the pH of B-RuO2 and RuO2. c Calculated PDOS of the O 2p orbitals for RuO2 and B-RuO2. The Fermi level (Ef) was shifted to zero, and the p-band center was denoted as Ɛp. Operando DEMS signals of 32O2, 34O2, and 36O2 for 18O labeled-RuO2 (d) and B-RuO2 (e) in H216O electrolyte during three LSV tests. DEMS measurements were performed in 0.1 M HClO4 prepared with H216O or H218O using a catalyst-loaded Au-coated PTFE working electrode with a catalyst loading of approximately 0.8 mg cm−2. f The signal intensity ratios of 34O2 /32O2 and 36O2/32O2 for 18O labeled-RuO2 and B-RuO2. Data are shown as mean ± standard deviation from three consecutive CV tests. g In situ FTIR spectra of B-RuO2 and RuO2 from 1.0 to 1.9 V vs. RHE. In situ FTIR measurements were performed in 0.1 M HClO4 (pH = 1) using a three-electrode FTIR cell with a catalyst loading of approximately 0.32 mg cm−2. h Microkinetic volcano activity model with the model-derived activity descriptors of RuO2 and B-RuO2. i Calculated PDOS of the dz2 orbitals of the active Ru site in RuO2 and B-RuO2. The Fermi level (Ef) was shifted to zero. Source data are provided as a Source data file.
To gain theoretical insight, we performed DFT calculations on the B-RuO2(110) surface. Surface Pourbaix diagram analysis suggests that the surface covered by 1 monolayer (ML) oxygen under OER-relevant potentials is thermodynamically favored (Supplementary Fig. 51a, b), consistent with previous studies on RuO2-based materials and provides a reasonable reference state for further analysis11,66,67. We further compared different configurations with varying boron positions in the sub-layer and used the energetically favorable structure illustrated in Supplementary Fig. 51c for electronic structure analysis. Projected density of states (PDOS) analysis reveals a profound modulation of the lattice oxygen electronic structure. As exemplified in Fig. 6c, the oxygen 2p band center (Ɛp) was downshifted away from the Fermi level (Ef), from −2.4 to −2.57 eV after boron doping. This downshift is consistent with reduced Ru 4d-O 2p hybridization, which may suppress the activation of the LOM pathway13 and thereby improve structural stability.
To experimentally examine this model-derived inference, we directly probed lattice oxygen participation using 18O isotope-labeled operando DEMS (Supplementary Fig. 52). 18O isotope labeling was performed on RuO2 and B-RuO2 catalysts via LSV in 0.1 M HClO4 + H218O electrolyte (Supplementary Fig. 53). Mass spectrometry analysis of oxygen evolution products (Fig. 6d, e) reveals distinct m/z signals at 32, 34, and 36 for both 18O-labeled catalysts. B-RuO2 significantly suppresses the formation of 34O2 and 36O2 products compared to RuO2. Quantitative analysis of oxygen isotope ratios reveals that B-RuO2 exhibits reduced lattice oxygen participation in the OER compared to RuO2. Specifically, the 34O2/32O2 mass signal ratio for B-RuO2 is 0.45%, compared to 0.71% for RuO2, and the 36O2/32O2 mass signal ratio is 0.005% for B-RuO2 versus 0.043 % for RuO2 (Fig. 6f), indicating a lower contribution of lattice oxygen to OER in the boron-doped material. Collectively, these experimental results support that subsurface strong B-O bonding effectively anchors the surface lattice oxygen, thereby suppressing the LOM pathway and contributing to the high structural stability of B-RuO213.
We further employed in situ electrochemical FTIR spectroscopy to probe the adsorption behavior of the OER intermediates (Fig. 6g and Supplementary Fig. 54). The spectra exhibit two distinct peaks at ~1120 and ~1230 cm−1, attributed to OOH*/OO* intermediate adsorption and monocrystalline Si substrate oxidation (Si-O-Si), respectively68. Notably, as the applied potential increases, B-RuO2 displays enhanced OOH*/OO* adsorption, whereas no such signal is observed in RuO2. These in situ spectroscopic results further support that OER on B-RuO2 proceeds more predominantly through the adsorbate evolution mechanism (AEM), with boron doping facilitating the formation of oxygenated intermediates.
To provide complementary insight into the enhanced intrinsic activity, we performed advanced microkinetic modeling69. As depicted in Fig. 6h, the descriptor of B-RuO2 lies closer to the volcano apex than that of RuO2, consistent with the experimentally observed activity enhancement and suggesting faster HOO* formation kinetics, as proposed by Dickens et al.69. Furthermore, PDOS analysis on the dz2 orbital69,70 of surface Ru was conducted for both RuO2 and B-RuO2. Figure 6i shows a negligible electron density near the Fermi level for RuO2. In contrast, B-RuO2 exhibits a pronounced electron distribution at the same energy level, potentially enhancing its affinity for oxygen-containing intermediates during the OER process.