
Synthesis strategy and morphological structural characterizations of Ru0.5Ir0.5O2
The synthesis strategy is to uniformly disperse (at the atomic level) the catalytic active components (Ru/Ir atoms) in the catalysts. In RuO2 and IrO2, Ru/Ir atoms have the same valence state, the same crystal structure type and similar chemical properties, which are conducive to synthesis substitutional solid solution. In a typical experiment, IrCl3 (0.5 M) and KOH were mixed and thoroughly ground and the mixture was heated again by a mechano-thermal method29. The cooled solid was thoroughly ground again with addition of RuCl3 (0.5 M) and KOH and heated again by a mechano-thermal method to obtain Ru0.5Ir0.5O2 product29. Both heating processes are heated to 800 °C for 2 h. One thing should be noted that when further annealing Ru0.5Ir0.5O2 at 900 °C for 2 h, it obtains the mixture of thermally stable rutile phase IrO2 and RuO2 (Supplementary Fig. 1), which demonstrates that the synthesized Ru0.5Ir0.5O2 is a solid solution. Ru species have higher OER activity than Ir species. In order to achieve higher OER activity, more Ru species are highly suggested to incorporate in the substitutional solid solution. Unfortunately, when the molar amount of raw material (RuCl3) in the second synthetic step was further increased to more than 0.5 M (i.e., the molar ratio of Ru: Ir larger than 1), a large amount of soluble Ru/Ir complexes were generated in the obtained product (Supplementary Fig. 2). Therefore, the optimal molar ratio of Ru in two-dimensional RuIr oxides is 0.5.
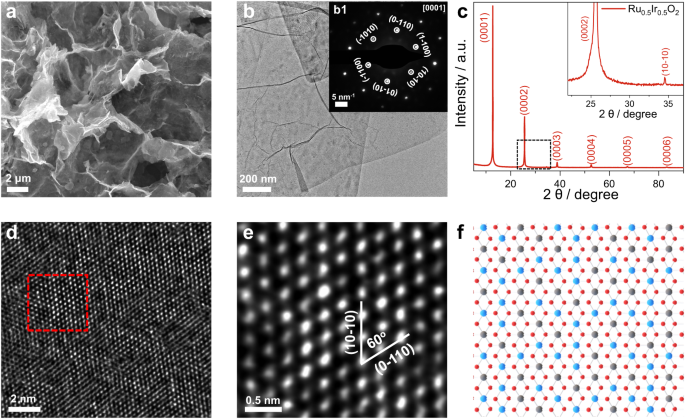
As shown in the scanning electronic microscopy (SEM) image (Fig. 1a) and transmission electron microscopy (TEM) images (Fig. 1b and Supplementary Fig. 3a), Ru0.5Ir0.5O2 exhibits a typical two-dimensional (2D) sheet-like shape structure with a large diameter of about 3–5 μm. Atomic force microscopy (AFM) image further confirms the two-dimensional structure where the thickness of the Ru0.5Ir0.5O2 nanosheet is approximately 1.9 nm (Supplementary Fig. 3b, c). Brunauer-Emmett-Teller (BET) adsorption-desorption isotherm reveals that the Ru0.5Ir0.5O2 nanosheets exhibit a relatively high surface area (25.8 m2 g−1) (Supplementary Fig. 4 and Supplementary Table 1). The TEM energy-dispersive X-ray spectroscopy (TEM-EDX) and inductively coupled plasma atomic emission spectra (ICP-AES) were used to determine the chemical composition ratio of Ru0.5Ir0.5O2. The measured atomic ratio of Ru: Ir: O is about 0.46–0.50: 0.54–0.50: 2 (Supplementary Fig. 3d and Supplementary Table 2). High-angle annular dark-field scanning TEM (HAADF-STEM) image and scanning transmission electron microscopy energy dispersive X-ray spectroscopy (STEM-EDX) element mapping reveal that Ru, Ir and O are uniformly distributed throughout the nanosheet (Supplementary Fig. 3g). At the same time, commercial IrO2 (C-IrO2) and commercial RuO2 (C-RuO2) were characterized by X-ray diffraction (XRD), SEM, TEM, and HAADF-STEM. Both the structure characterizations showed the stable rutile phase C-IrO2 and rutile phase C-RuO2 (Supplementary Figs. 5 and 6).

a SEM and b TEM images of Ru0.5Ir0.5O2. b1 The SAED pattern of Ru0.5Ir0.5O2, where the hexagonal pattern shows the [0001] projection. c XRD pattern of Ru0.5Ir0.5O2. The inset is a larger view of the marked area in c. d. The aberration-corrected HAADF-STEM image for Ru0.5Ir0.5O2. e High-magnification image of the region in d. f The schematic atom structure of Ru0.5Ir0.5O2, the Ru, Ir, O atoms are represented by blue, gray and red spheres.
The powder XRD was used to further confirm the crystal structure and the phase properties of the synthesized Ru0.5Ir0.5O2. The sharp Bragg diffraction peaks in the XRD pattern illustrate the high crystallinity and ordered stacking of the 2D layers in Ru0.5Ir0.5O2 (Fig. 1c). Meanwhile, the highly crystalline structures of Ru0.5Ir0.5O2 were also confirmed by the lattice-resolved high-resolution TEM (HRTEM) image (Supplementary Fig. 3e) and the corresponding fast Fourier transform (FFT) pattern (Supplementary Fig. 3f). Selected area electron diffraction (SAED) pattern obtained at the Ru0.5Ir0.5O2 nanosheets is compatible with the trigonal crystal structure (Fig. 1). The atomic structure of was further clarified by aberration-corrected HAADF-STEM image. As shown in Fig.1d, a highly ordered arrangement of metal atoms can be observed. Figure 1e (the high-magnification image of the region in Fig. 1d) reveals that the ordered arranged metal atoms have different brightness, arising from a random and even distribution of Ir and Ru atoms of different brightness, which is also consistent with the substitutional solid solution structure of Ru0.5Ir0.5O2. Ru0.5Ir0.5O2 crystal were modeled as shown in Fig. 1f, where the blue, gray and red spheres schematically represent the arrangement of Ru, Ir and O atoms of Ru0.5Ir0.5O2. Combining with the XRD result (Fig. 1c), the unit-cell parameters of Ru0.5Ir0.5O2 can determined to be a = b = 3.00 Å, c = 6.95 Å; α = β = 90°, γ = 120°.
The composition and chemical states of Ru0.5Ir0.5O2 were then analyzed by X-ray photoelectron spectroscopy (XPS). As depicted in the XPS spectra, Ru0.5Ir0.5O2 exhibits a meaningful negative-shift of Ru 3p3/2 and Ru 3p1/2 peaks (461.6 and 483.6 eV) in comparison with those for C-RuO2 (462.0 and 484.0 eV) (Fig. 2a), which confirms the a lower valence state of Ru in Ru0.5Ir0.5O2 than that in C-RuO2 (RuIV+)18,24. Ir 4 f XPS spectra (Fig. 2b) show the peaks located at 62.2 and 65.2 eV, which are assigned to Ir 4f7/2 and Ir 4f5/2 of IrIV+ 24. Compared with those of C-IrO2 (61.8 and 64.8 eV), Ru0.5Ir0.5O2 shows a slight positive-shift. Which indicates that Ru0.5Ir0.5O2 has the higher Ir valence state than C-IrO230. The fitting parameters used of all peaks can be found in Supplementary Table 3.

a Ru 3p XPS spectra of Ru0.5Ir0.5O2 and C-RuO2. b Ir 4 f XPS spectra of Ru0.5Ir0.5O2 and C-IrO2. c Ru K-edge XANES spectra of Ru0.5Ir0.5O2, C-RuO2 and Ru foil. d Ir L3-edge XANES spectra for Ru0.5Ir0.5O2, C-IrO2 and Ir foil. e Fourier-transformed EXAFS spectra of Ru K-edge spectra for Ru0.5Ir0.5O2, C-RuO2 and Ru foil. f Fourier-transformed EXAFS spectra at Ir L3-edge collected for Ru0.5Ir0.5O2, C-IrO2 and Ir foil. g–i Ru K-edge WT-EXAFS of Ru0.5Ir0.5O2, C-RuO2 and Ru foil. j–l Ir L3-edge WT-EXAFS of Ru0.5Ir0.5O2, C-IrO2 and Ir foil.
The white line of X-ray absorption near-edge structure (XANES) was used to explore the electron transition behavior and electronic structure of Ru0.5Ir0.5O2, and the intensity analysis of which can give the clearer valence electronic state information31. As depicted in Fig. 2c, the white-line region of Ru K-edge for Ru0.5Ir0.5O2 shows the white-line adsorption energy of which is between that of C-RuO2 and Ru foil, indicating that the valence state of Ru in Ru0.5Ir0.5O2 is between 0 and +432,33. Meanwhile, by characterizing the intensity of white-line intensity of Ir L3-edge XANES spectra, the Ir valence state can be more easily observed. Figure 2d shows that the white line peak intensity of Ru0.5Ir0.5O2 exhibits significantly higher than that of C-IrO2 and Ir foil, demonstrating that the valence states of Ir show an order of Ru0.5Ir0.5O2 > C-IrO2 > Ir foil34. The valance state results of Ru and Ir species were consistent with those discussed earlier in the XPS results. The Fourier transforms of the extended X-ray absorption fine structure (EXAFS) spectra (Fig. 2e, f) at the Ru K-edge and Ir L3-edge were conducted to investigate the local chemical environment of Ru0.5Ir0.5O224. The FT-EXAFS of Ru K-edge and Ir L3-edge reveal that the bond length of Ru-O in Ru0.5Ir0.5O2 is slightly increased compared to that of C-RuO2, and the length of Ir-O bonds is also increased compared to that of C-IrO2, which may be due to different crystal structure as the metal-oxygen bonds in 1 T phase are larger than those in rutile. (Fig. 2e, f, Supplementary Figs. 7–9 and Supplementary Table 4). This suggests the interaction between Ru, O and Ir13. Figure 2e, f shows that the peaks in the R-space at around 1.5 Å and 1.6 Å corresponds to the coordination Ru-O shell and Ir-O shell, indicating that Ru0.5Ir0.5O2 has the typical RuO6 and IrO6 coordination octahedron as shown in Supplementary Table 4. As shown in Supplementary Figs. 8, 9 and Supplementary Table 4, The fitting curves in Ru0.5Ir0.5O2 and reference samples also coincided well with the experimental spectra, which also reveals that there is an interaction between the Ru and Ir. The local structure of Ru-O-Ir was further observed using the wavelet transform of EXAFS (WT-EXAFS)35. Compared with the reference samples, Ru-Ir, Ir-Ru scattering signals appeared in Ru K-edge (Fig. 2g–i) and Ir L3-edge (Fig. 2j–l) WT-EXAFS, respectively, which indicated that Ru and Ir had a strong interaction in Ru0.5Ir0.5O213. The presence of strong interactions in these Ru-O-Ir local structures may avoid the formation of more soluble Ru/Ir high-valent complexes and thus significantly improve the stability of electrocatalysts13,36. All structure and characterization information conclude that the Ru0.5Ir0.5O2 belongs to the space group of P-3m1.
Electrochemical performances
The OER performance of Ru0.5Ir0.5O2 was evaluated in O2-saturated 0.5 M H2SO4 electrolyte and compared with the advanced C-IrO2 and C-RuO2 electrocatalysts. The saturated calomel electrode (SCE) was used as a reference electrode and was calibrated prior to electrocatalytic testing (Supplementary Fig. 10). The linear sweep voltammetry (LSV) curves of all catalysts are normalized by the geometric area of glassy carbon electrode (GCE) (with the mass loading of 283 μg cm−2) with iR-correction (Supplementary Figs. 11 and 12). As can be seen from Fig. 3a, Supplementary Fig. 13, Ru0.5Ir0.5O2 exhibits the lowest onset potential (η0.3) of 1.30 V vs. reversible hydrogen electrode (RHE) at 0.3 mA cm−2. And to deliver a current density of 10 mA cm−2, Ru0.5Ir0.5O2 only requires a minimum overpotential (η10) of 151 mV, while the overpotentials (η10) of C-IrO2 and C-RuO2 were 321 and 297 mV, respectively. Besides, the lowest Tafel slope for Ru0.5Ir0.5O2 (45 mV dec−1) indicates that the fastest kinetic velocity compared to C-IrO2 (126 mV dec−1) and C-RuO2 (108 mV dec−1) (Fig. 3b). In addition, Supplementary Fig. 14 shows that the OER performance achieved by Ru0.5Ir0.5O2 has good reproducibility.

a The OER polarization curves of Ru0.5Ir0.5O2, C-IrO2 and C-RuO2 in O2-saturated 0.5 M H2SO4 electrolyte with iR-correction (mass loading ∼283 ‘μg cm−2). b Tafel plots of Ru0.5Ir0.5O2, C-IrO2 and C-RuO2 collected in 0.5 M H2SO4 electrolyte were calculated from the corresponding LSV curves (a). c The comparison of overpotentials at 10 mA cm−2 and current densities at 1.44 V vs. RHE for different catalysts. d Mass activities and TOFs of Ru0.5Ir0.5O2, C-IrO2 and C-RuO2. e The comparison of chronopotentiometric measurements for different catalysts. f The Comparison of the required overpotential at 10 mA cm−2 and chronopotentiometry durability in acidic media for various reported electrocatalysts (Supplementary Table 7).
Figure 3c shows the comparison of the overpotential (η10) at 10 mA cm−2 and the current density at 1.440 V vs. RHE for different electrocatalysts. It is noteworthy that the current density of Ru0.5Ir0.5O2 reaches 169.7 mA cm−2 at 1.440 V vs. RHE, which is 106.1 times and 141.4 times of C-IrO2 (1.6 mA cm−2) and C-RuO2 (1.2 mA cm−2), respectively. The gas chromatographic diagram analysis was further used to confirm the formation of O2 gas and evaluate the Faraday efficiency of O2. The data of the produced oxygen by Ru0.5Ir0.5O2 at 20 mA cm−2, 40 mA cm−2, 100 mA cm−2 in 0.5 M H2SO4 electrolyte were collected (Supplementary Fig. 15). Supplementary Fig. 16 shows that the O2 Faraday efficiencies of Ru0.5Ir0.5O2 at different current densities are in close proximity to 100%.
In order to compare the intrinsic activity of the prepared electrocatalysts, the mass activity and the turnover frequency (TOF) of the prepared electrocatalysts were calculated based on the total loaded mass of the noble metal (Ir + Ru). Figure 3d manifests the mass activities of Ru0.5Ir0.5O2 reach 730.4 A gIr + Ru−1 at 1.440 V vs. RHE, which are 110.7 and 130.4 times higher than those of C-IrO2 (6.6 A gIr + Ru−1 at 1.440 V vs. RHE) and C-RuO2 (5.6 A gIr + Ru−1 at 1.440 V vs. RHE). The turnover frequency (TOF) of noble metal site was also calculated. Figure 3d shows that the TOF of Ru0.5Ir0.5O2 (6.84 s−1 at 1.440 V vs. RHE) was nearly 136.8 and 171 times higher than that of C-IrO2 (0.05 s−1 at 1.440 V vs. RHE) and C-RuO2 (0.04 s−1 at 1.440 V vs. RHE).
To better understand the origin of the high OER performance of Ru0.5Ir0.5O2, we explored the electrochemical double-layer capacitance (Cdl) test and the electrochemically active surface area (ECSA) was calculated by Cdl for activity normalization (Supplementary Figs. 17, 18 and Supplementary Fig. Table 5). The prepared Ru0.5Ir0.5O2 with typical two-dimensional (2D) sheet-like shape structure exhibited higher Cdl and ECSA than those of C-IrO2 and C-RuO2 (Supplementary Fig. 17 and Supplementary Table 5), suggesting that 2D shape can significantly improve the density of active sites. The OER activity normalized to the ECSA and BET of the catalysts were also calculated (Supplementary Figs. 18 and 19). The specific activity of Ru0.5Ir0.5O2 was better than those of all the other samples. These results show that Ru0.5Ir0.5O2 has superior intrinsic OER catalytic activity.
The operational durability is the key to evaluate the application potential of OER catalyst. Thus, the stability of the Ru0.5Ir0.5O2 electrocatalyst was performed by using chronopotentiometric measurement at a constant current density of 10 mA cm−2, showing that the catalyst exhibits a stable overpotential for 618.3 h (Fig. 3e). The overpotential of the Ru0.5Ir0.5O2 at 10 mA cm−2 increased from 151 mV to 204 mV in first 100 h test, to 214 mV at the end of the test (Supplementary Fig. 20). And the mean increase of overpotential was 0.102 mV h−1. This is much slower than that of the contrast catalysts. For instance, at a constant current density of 10 mA cm−2, C-IrO2 was kept stable for only 19.5 h (2.67 mV h−1), and C-RuO2 was inactivated after 23.5 h test (15.83 mV h−1). The amount of dissolved Ru and Ir ions in the electrolyte at different times during the stability test of Ru0.5Ir0.5O2 was determined by ICP-AES analysis (Supplementary Table 6). The concentration of Ru ion is higher than that of Ir ion, which may be attributed to the dissolution of Ru in an acidic medium. Nevertheless, the dissolution of Ru and Ir ions remained at a very low level (less than 30.0 ppb) and varied slightly over time. The chemical state of Ru0.5Ir0.5O2 after the stability test was also confirmed by XPS analysis. The Ru 3p3/2 (462.2 eV) and Ru 3p1/2 (484.2 eV) peaks of Ru0.5Ir0.5O2 after the stability test were positive-shifted compared with before the stability test (Supplementary Fig. 21a). And Ir 4f7/2 (61.6 eV) and Ir 4f5/2 (64.6 eV) peaks showed that there was is a slight negative-shift compared with before stability tests (Supplementary Fig. 21b). The XPS analysis shows that the surface oxidation state of Ru increased and the surface oxidation state of Ir decreased compared with before the test during the OER stability test. Furthermore, the XANES analyses also reveal that the valence state of Ru increased slightly and the oxidation state of Ir decreased slightly after the stability test compared with before the test (Supplementary Fig. 22). These may be due to the strong interaction between Ir-Ru and the electron transition behavior that limits the redox elasticity of Ru13,19,20,21, avoiding the generation of more soluble Ru high-valent complexes and also the origin of high stability of the Ru0.5Ir0.5O225,26,27.
The morphology and crystal structure of Ru0.5Ir0.5O2 after acid OER stability test were further confirmed by morphology characterization. The Bragg diffraction peaks in the XRD pattern of Ru0.5Ir0.5O2 were basically unchanged, and no other peaks corresponding to rutile C-IrO2 and rutile C-RuO2 were observed (Supplementary Fig. 23a). As shown in Supplementary Fig. 23b, the original two-dimensional sheet structure of Ru0.5Ir0.5O2 basically remained after stable operation test under harsh conditions. The SAED pattern (Supplementary Fig. 23c), HRTEM image and the corresponding fast Fourier transform (FFT) pattern (Supplementary Fig. 23d) reveal that the crystal structure change of Ru0.5Ir0.5O2 is negligible. Furthermore, the STEM-EDX element mapping (Supplementary Fig. 23e) shows the uniform distribution of Ir and Ru elements. And the TEM-EDX shows the Ru, Ir and O elements of Ru0.5Ir0.5O2 after acid OER stability test with an atomic ratio of about 0.50: 0.51: 2.17 (Supplementary Fig. 23f). Due to long-term stability tests, part of the metal cation dissolved in the electrolyte.
The stability of Ru0.5Ir0.5O2 was further demonstrated by the accelerated durability test-cyclic voltammetry (ADT-CV). Supplementary Fig. 24a showed the cyclic voltammogram (CV) test of Ru0.5Ir0.5O2 for 1000 cycles with a scan rate of 100 mV s−1. Supplementary Fig. 24b showed the OER polarization curves of Ru0.5Ir0.5O2 before and after 1000 cycles. After the ADT test, the overpotential (η @10 mA cm−2) of Ru0.5Ir0.5O2 was increased by 11 mV (Supplementary Fig. 24b) and The Tafel slopes of Ru0.5Ir0.5O2 before and after ADT are 44 mV dec−1 and 49 mV dec−1 respectively (Supplementary Fig. 24c), indicating that Ru0.5Ir0.5O2 has good stability. And the characterization of Ru0.5Ir0.5O2 after 1000 cycles of ADT-CV showed that the change in crystallinity of Ru0.5Ir0.5O2 before and after ADT was negligible (Supplementary Fig. 25).
In addition, Ru0.5Ir0.5O2 (mass loading ∼1.0 mg cm−2) was used as an anode catalyst in acidic PEM electrolyte (0.5 M H2SO4) at room temperature (Supplementary Fig. 26). The PEM electrolyzers can achieve current densities of ~200 mA cm−2 at least 255 h by using Ru0.5Ir0.5O2 catalyst, and the performance of PEM electrolyzer without significant performance degradation. We compared the OER performance of Ru0.5Ir0.5O2 with the reported OER electrocatalysts in terms of activity, TOF, mass activity, and stability. As shown in Fig. 3f and Supplementary Table 7, the performance of Ru0.5Ir0.5O2 is one of the most active electrocatalysts of the state-of-the-art Ru/Ir-based OER electrocatalysts reported in the reported literature.
Effect of charge on the OER performance
The electrochemical cyclic voltammetry (CV) tests of Ru0.5Ir0.5O2, C-IrO2, and C-RuO2 were measured in the anhydrous acetonitrile to explore the intrinsic redox capacity of the catalysts. As shown in Supplementary Fig. 27, the prepared catalysts exhibit a series of significant redox peaks in the range of −1.2 to 2.0 V vs. NHE in anhydrous acetonitrile. As depicted in Fig. 4a, compared to C-IrO2 and C-RuO2, Ru0.5Ir0.5O2 shows an increase in the oxidation state under a low applied voltage. Combined with the electron structure characterization (XPS, XPS simulation, Bader charges and XAS results before and after the long-term OER testing), CV results indicate that Ru species in Ru0.5Ir0.5O2 material are more easily oxidized than Ir species under the same conditions. It suggests that Ru0.5Ir0.5O2 is more likely to generate more high valence Ru active sites than C-IrO2 and C-RuO2 at low applied voltage, which may mainly be responsible for the good acidic oxygen evolution reaction (OER) activity over Ru0.5Ir0.5O213,37,38,39.

a CV curves of Ru0.5Ir0.5O2, C-IrO2 and C-RuO2 in anhydrous acetonitrile. b PVC protocol of Ru0.5Ir0.5O2, C-IrO2 and C-RuO2 between 1.195 V vs. RHE cathodic and 1.245 to 1.645 V vs. RHE anodic non-iR corrected potentials in O2-saturated 0.5 M H2SO4 electrolyte. c PVC protocol (black) and showing oxidation and reduction with current response (red). d The anodic and inverted cathodic current decay of Ru0.5Ir0.5O2. e Total charge (integral anodic charge) of Ru0.5Ir0.5O2, C-IrO2 and C-RuO2 versus potential from PVC. f Anodic capacitance derived from normalized anodic charge to potential step from the PVC. g The TPV curves of Ru0.5Ir0.5O2, C-IrO2 and C-RuO2. h Intensity-Time curves of Ru0.5Ir0.5O2, C-IrO2 and C-RuO2 at 10 Hz. (t1, t2 and t3 are the peak time of Ru0.5Ir0.5O2, C-IrO2 and C-RuO2, respectively). i Comparison of peak occurrence time of Ru0.5Ir0.5O2 with peak occurrence time of C-IrO2 and C-RuO2 at different frequencies (10, 20, 30 40, 50, 60, 70 and 80 Hz).
The degree of oxidation of the active site in the catalyst and the concentration of the oxidative charge on the surface directly respond to the OER rate40,41. Therefore, in order to determine the instantaneous oxidation state of the Ru active site during the OER process, we used the pulse voltage induced current (PVC) test method to compare potential, charge and quantify the capacitance of the catalysts under different biases. The bias applied in the PVC test preferentially acted on the oxidation process of the metal, and the resulting oxidative charge on the metal surface is then involved in the OER reaction process, and the change in the oxidation state of the metal causes the capacitance of the catalyst to change40,42,43. Thus, the instantaneous oxidation state of the active site during OER can be determined, and the sensitivity can be adjusted according to the size of the applied bias interval. According to XANES data and CV data, Ru is easier to be oxidized in the Ru0.5Ir0.5O2 solid solution, so the changes in solid solution capacitance can be regarded as the change of Ru pseudo-capacitance, and the existence of pseudo-capacitance in Ir/Ru based materials is well known42,44. Figure 4b shows a typical PVC protocol between the 1.195 V vs. RHE cathode and the 1.245 to 1.645 V vs. RHE anode non-iR correction potential. As shown in Fig. 4c, the part of the PVC (black) reveals oxidation and reduction pulses with current response (red). Figure 4d shows the anodic and inverted cathodic current decay of Ru0.5Ir0.5O2. By integrating the current (OER current is deducted as background current) response of the anodic voltage pulses, the charge (the total charge with respect to the anodic bias) stored in the catalyst at a given potential can be quantified. As highlighted in Fig. 4e, this approach can obtain the relationship between stored charge and potential. The change of charge in potential is bilinear for pre-catalysts, and the slope change indicates that the capacitance was changed. Figure 4f shows the relationship between capacitance and potential, which shows the capacitance of Ru0.5Ir0.5O2 begins to drop from about 2.45 mF at 1.325 V vs. RHE. The capacitance of C-IrO2 and C-RuO2 begin to change at 1.485 V, 1.505 V vs. RHE, respectively. And the charge-log (current densities) profile (Supplementary Fig. 28) shows that the accumulation of oxidation charge may affect the OER reaction40. These results show that the voltages required for the increased the accumulation of Ru oxidation charge in Ru0.5Ir0.5O2 is much lower than those of other reference samples and the applied voltages generate more Ru active sites with high oxidation states in Ru0.5Ir0.5O2.
In addition, we carried out in situ Ru K-edge XAS to further observe the trend of Ru oxidation state change with applied voltage increasing. As depicted in Supplementary Fig. 29, we observe that the oxidation state of Ru increases with the increase of applied voltage. The oxidation state of Ru increased significantly within 1.41 V vs. RHE. The above results support that the applied voltage has a key role in the promotion of high-valence Ru sites, which are known to be more active than RuIV+ species13,38,39. When the applied voltage is increased to 1.51 V vs. RHE, further oxidation of Ru is limited and stability is improved mainly due to the stable Ru-O-Ir local structure. We surmise that the high performance of Ru0.5Ir0.5O2 may mainly be mainly due to the fact that the applied voltage promotes the accumulation of oxidation charge in Ru0.5Ir0.5O2 (that is, more Ru active species with high oxidation state are generated), thus improving the OER activity of the catalyst.
The presence of the local structure of Ru-O-Ir and large amount of capacitance in Ir/Ru based materials may impede electron transmission. Based on this, the transient photo-induced voltage (TPV) test was measured as an effective means to explore the electron transfer behavior of different catalysts45,46. The schematic diagram of the test device is shown in Supplementary Fig. 30. Figure 4g shows typical TPV attenuation curves of Ru0.5Ir0.5O2, C-IrO2 and C-RuO2. The decay rate is usually described by fitting the time decay constant (τ) value (the lower τ, the faster the charge transfer rate)47,48. The τ values of Ru0.5Ir0.5O2, C-IrO2 and C-RuO2 were calculated to be 0.32254 ms, 0.18312 ms and 0.11633 ms, respectively. Because the Ru pseudo-capacitance in Ru0.5Ir0.5O2 is easy to change and the oxidation state of Ru is easy to increase. And before and after laser the irradiation of Ru0.5Ir0.5O2 can be regarded as the charge-discharge process of pseudo-capacitance in the material. Simultaneously, there are strong interactions in the local structure of Ru-O-Ir. These results cause that the electron transfer rate of Ru0.5Ir0.5O2 solid solution decreases significantly.
The fast Fourier transform (FFT) technique based on TPV data was used to further analyze the electron transfer behavior of catalysts46. Supplementary Fig. 31 shows the FFT curves of Ru0.5Ir0.5O2, C-IrO2 and C-RuO2. None of these curves has obvious peak values, which means that there are no obvious static frequency and periodic frequency components in the TPV attenuation curve48. FFT can only identify the frequency component of TPV signal, but not the relationship between frequency and time. In order to study the non-static characteristics of TPV curves, Continuous Wavelet Transform (CWT) was applied to TPV data. 2D and 3D CWT spectra of Ru0.5Ir0.5O2, C-IrO2 and C-RuO2 are shown in Supplementary Fig. 32, which involve three parameters: time, frequency and intensity.
Low frequency represents slow electron transport, and high frequency means fast electron transport45. In order to further analyze the dynamics of the electron transport process, the intensities of peak positions at different frequencies (10–80 Hz) were compared with the relationship between time45,46,47. It can be seen from Fig. 4h that in the relatively slow electron transfer process of 10 Hz, the peak position of Ru0.5Ir0.5O22 moves backwards at 10 Hz on the time scale, indicating that the charge transfer rate is slowing down. Similarly, comparisons at other higher different frequencies confirm this same conclusion (Supplementary Fig. 33). In addition, at different frequencies, the time difference (Δt) of peak values between C-IrO2 (black line, t1–t2), C-RuO2 (red line, t1–t3), and Ru0.5Ir0.5O2 was calculated at different frequencies, respectively, using the time of the Ru0.5Ir0.5O2 (t1) as the peak reference value. As shown in Fig. 4i, the values of Δt from 10 Hz to 80 Hz indicates that Ru0.5Ir0.5O2 has the slowest transfer rate during the charge transfer process46.
In summary, Ru0.5Ir0.5O2 exhibits record OER activity in sulfuric acid electrolyte may mainly be due to more Ru active sites with high oxidation states generated at low applied voltage. And the local structure of Ru-O-Ir in Ru0.5Ir0.5O2 has strong interaction and high stability, which prevents excessive oxidation and dissolution of the active site.
Theoretical insights of OER activity and stability on Ru0.5Ir0.5O2
We used density functional theory (DFT) simulations to rationalize the observed OER activity and understand the effect of Ru on the OER performance in Ru0.5Ir0.5O2 catalyst. Consistent with the XRD pattern (Fig. 1c), Ru0.5Ir0.5O2 crystal were modeled to have a 1T-crystal structure with a unit cell of a = b = 3.00 Å and c = 6.95 Å (Fig. 5a). Both C-IrO2 and C-RuO2 crystals were modeled as rutile crystal structures (Fig. 5b, c). The lattice parameters of bulk rutile IrO2 were determined to be a = b = 4.45 Å and c = 3.19 Å. The lattice parameters of bulk rutile RuO2 were determined to be a = b = 4.54 Å and c = 3.14 Å. In our DFT models for Ru0.5Ir0.5O2, we approached the problem by substituting Ir atoms of 2D IrO2 with Ru atoms to reach an atomic ratio of Ru/Ir = 1:1, which aligns closely with the experimental value. In order to obtain relatively stable Ru0.5Ir0.5O2 structure, we constructed Ru0.5Ir0.5O2 with different permutations of Ir atoms and Ru atoms, and performed optimization calculations on these models (Fig. 5a and Supplementary Fig. 34), the calculation results of the most stable structure are shown in Fig. 5a.

a Atomistic structure and Edft of the Ru0.5Ir0.5O2 (−331.4 eV). Atomistic structures of C-IrO2 (b) and C-RuO2 (c) (blue, Ru; gray, Ir; red, O). d Schematic illustration of OER mechanism on the Ru0.5Ir0.5O2 (blue, Ru; gray, Ir; red, O; white, H). e The reaction paths on Ru0.5Ir0.5O2 catalyst with the set potential of 0 and 1.23 V. The overpotential (ƞ) is labeled for viewing convenience.
We carried out additional XPS predictions and Bader charge analysis to verify the oxidation states of Ru and Ir species in Ru0.5Ir0.5O2. As shown in Supplementary Fig. 35a, the Ru 3p binding energy exhibits a decrease from C-RuO2 to Ru0.5Ir0.5O2, indicating a lower Ru oxidation state in Ru0.5Ir0.5O2, consistent with experiment. Meanwhile, as shown in Supplementary Fig. 35b, the Ir 4 f binding energy exhibits an increase from C-RuO2 to Ru0.5Ir0.5O2, indicating a higher Ir oxidation state in Ru0.5Ir0.5O2, consistent with experiment. These trends are also supported by the Bader charge analysis, as shown in Supplementary Table 8. Thus, both the XPS prediction and Bader charge analysis support the consistent oxidation state change compared with experiment. As shown in Supplementary Table 9, the bond length of Ru-O in Ru0.5Ir0.5O2 increased compared to that of C-RuO2 and the length of Ir-O bonds also increases compared to that of C-IrO2, which is consistent with experimental observations. For solid solutions, there are two factors that affect the bond length of metals-oxygen. One is the crystal structure, and the other is the valence state. In the 1 T phase structure, the metal-oxygen bond length is longer than that of the rutile phase;29 For valence states, the higher valence state corresponds to the shorter bond length, while the lower valence state corresponds to the longer bond length. In this work, the crystal structure has larger impact on to the bond length of Ir-O, so the bond length of the Ir-O in Ru0.5Ir0.5O2 is longer than that of the corresponding rutile phase.
We chose to study the catalytic performance of Ru0.5Ir0.5O2 (01-10) edge-site49,50, C-IrO2 (110) surface and C-RuO2 (110) surface29,51,52(Fig. 5a). We calculated the Gibbs free energy of all intermediates (*OH, *O, and *OOH) in each reaction step to obtain the theoretical OER overpotentials of Ru0.5Ir0.5O2, C-IrO2, and C-RuO2 surfaces, according to the four-step mechanism1. Figure 5d and Supplementary Figs. 36a, 37a depicted the reaction cycles of intermediates on the representative catalysts. As shown in Fig. 5e and Supplementary Figs. 36b, 37b, we found that O2 formation is the rate-determining step (RDS) in C-IrO2, and C-RuO2, and the corresponding limiting overpotential is 1.00 V and 0.81 V, respectively. For Ru0.5Ir0.5O2, generation of O2 is the PDS with an overpotential of 0.36 V. Thus, our DFT simulations showed that the Ru0.5Ir0.5O2 has the lowest OER overpotential (ƞOER = 0.36 V) compared to C-IrO2 (ƞOER = 1.00 V) and C-RuO2 (ƞOER = 0.81 V), coincident with our experimental observation that OER stability and catalytic activity of Ru0.5Ir0.5O2 catalyst were significantly improved.
Indeed, our prediction of overpotentials of catalysts are higher than the experiment, but still within the range of reported DFT results, as shown in Supplementary Tables 10 and 11. After systematically comparing the available published results (Supplementary Table 10), we realize that most of the existing DFT calculations overestimate the OER overpotentials of various reported catalysts. Among many factors affecting the overpotential predictions, we found the type of surface site is most important. We considered the edges of Ru0.5Ir0.5O2 as active sites. These simulations yielded a considerably lower overpotential of 360 mV, which aligns much more closely with the experimentally observed overpotential of 151 mV. We believe that this now adequately explained the difference between the predicted overpotential of DFT calculation and the experiment results. Remaining differences can be attributed to various sources of uncertainty inherent in both theoretical and experimental methods. Moreover, most of the existing DFT calculations exhibit a systematic overestimation of the OER overpotentials for IrO2 and RuO2 (Supplementary Table 11). These discrepancies can be reasonably attributed to the limitations in current DFT calculations.
In general, Ru0.5Ir0.5O2 can form more Ru active sites with high-valence at low applied voltage and the amount of oxidative charge stored in the Ru0.5Ir0.5O2 significantly affect the OER performance. The interactions within the Ru-O-Ir local structure, and two-dimensional structure characteristics play significant roles in stability of Ru0.5Ir0.5O2 electrocatalyst. DFT results also support that Ru0.5Ir0.5O2 is more active in OER than rutile phase C-IrO2 and C-RuO2. Because of these advantages, Ru0.5Ir0.5O2 showed significant superiority over the long-regarded state-of-the-art commercial OER electrocatalysts (IrO2 and RuO2).