
🏈 The latest on ELWAY
September 7, 2026
Our ELWAY forecasts have relaunched for the 2026 NFL season!
We’ll use this space to provide short narrative updates once the season is underway. We’re also hoping to publish a season preview piece before the official start of the NFL season on Wednesday night.
But the model is done after some extensive improvements and changes, and we didn’t want to sit on it even though it’s Labor Day. So enjoy your holiday, enjoy ELWAY, and then we’ll be back at you before the first kickoff with more NFL content.
Because of our extensive interactive charts and tables, ELWAY is best viewed on the web rather than over email or in your Substack client. The text and data on this page will change frequently. See here for our methodology. -NS, 9/7/2026
See also: QBERT quarterback ratings.
Despite football’s reputation for being less analytics-friendly than basketball or baseball, there is a lot of data to work with. The NFL is now in its 107th season. There’s now a quarter-century’s worth of reliable play-by-play data (since 2001) and 20 years (since 2006) of advanced quarterback tracking stats.
But it can take a bit of creativity to use that data effectively. ELWAY is probably Silver Bulletin’s most unique model. Most NFL ratings in the public domain are based on only a minimal amount of information, often just the final scores. ELWAY considers a lot more than that.
-
We account extensively for quarterback play through ELWAY’s sister model, QBERT. QBs literally account for almost a third of overall player value in the NFL, based on our analysis. We’ve made some changes this year that better separate out QB performance from wide receiver skill and team context.
-
ELWAY accounts for component stats showing repeatable performance, not just points and wins. We assign each team a series of game scores based on a comprehensive assessment of its performance. Efficiency measures, such as yards per play and first downs gained, are generally more predictive than scoring alone. Factors like turnovers and special teams decide many games but are noisier and harder to replicate. And it’s important to account for the game script. The result is a series of rolling ratings that update for each team after each game, the most important of which are offensive and defensive efficiency ratings.
-
ELWAY factors in offseason roster movement. We project value above replacement level (WAR) for each player on the roster based on QBERT for QBs and Pro-Football-Reference.com Approximate Value for other positions, accounting for different aging curves at different positions.
-
ELWAY extensively accounts for injuries, including both the resolution of current injuries and the potential for new injuries. Because we calculate a WAR for each player, we can translate it directly into effects on point spreads, game totals, and win probabilities. The injury system has been overhauled this year, and future QB injuries are now predicted by the model rather than using subjective injury grades.
-
ELWAY adjusts its forecast for many contextual factors, including an extensive system for evaluating home-field advantage (the Packers gain much more from playing at home than the Chargers), plus rest, coaching changes and even the weather.
-
Finally, ELWAY uses a simulation engine to produce realistic game scores: 24-21 games occur much more often in ELWAY than 25-20, for example. This allows for more precision when calculating point spreads, totals, and the handling of ties and overtime games.
But let’s start with our topline team ratings. A team’s offensive and defensive ratings represent, respectively, their projected number of points scored and allowed on a neutral site against an average opponent and can be combined to form a net rating. The Bills’ net rating of +4.7 means that we’d expect them to outscore an average opponent by roughly 5 points in Week 1, for example.
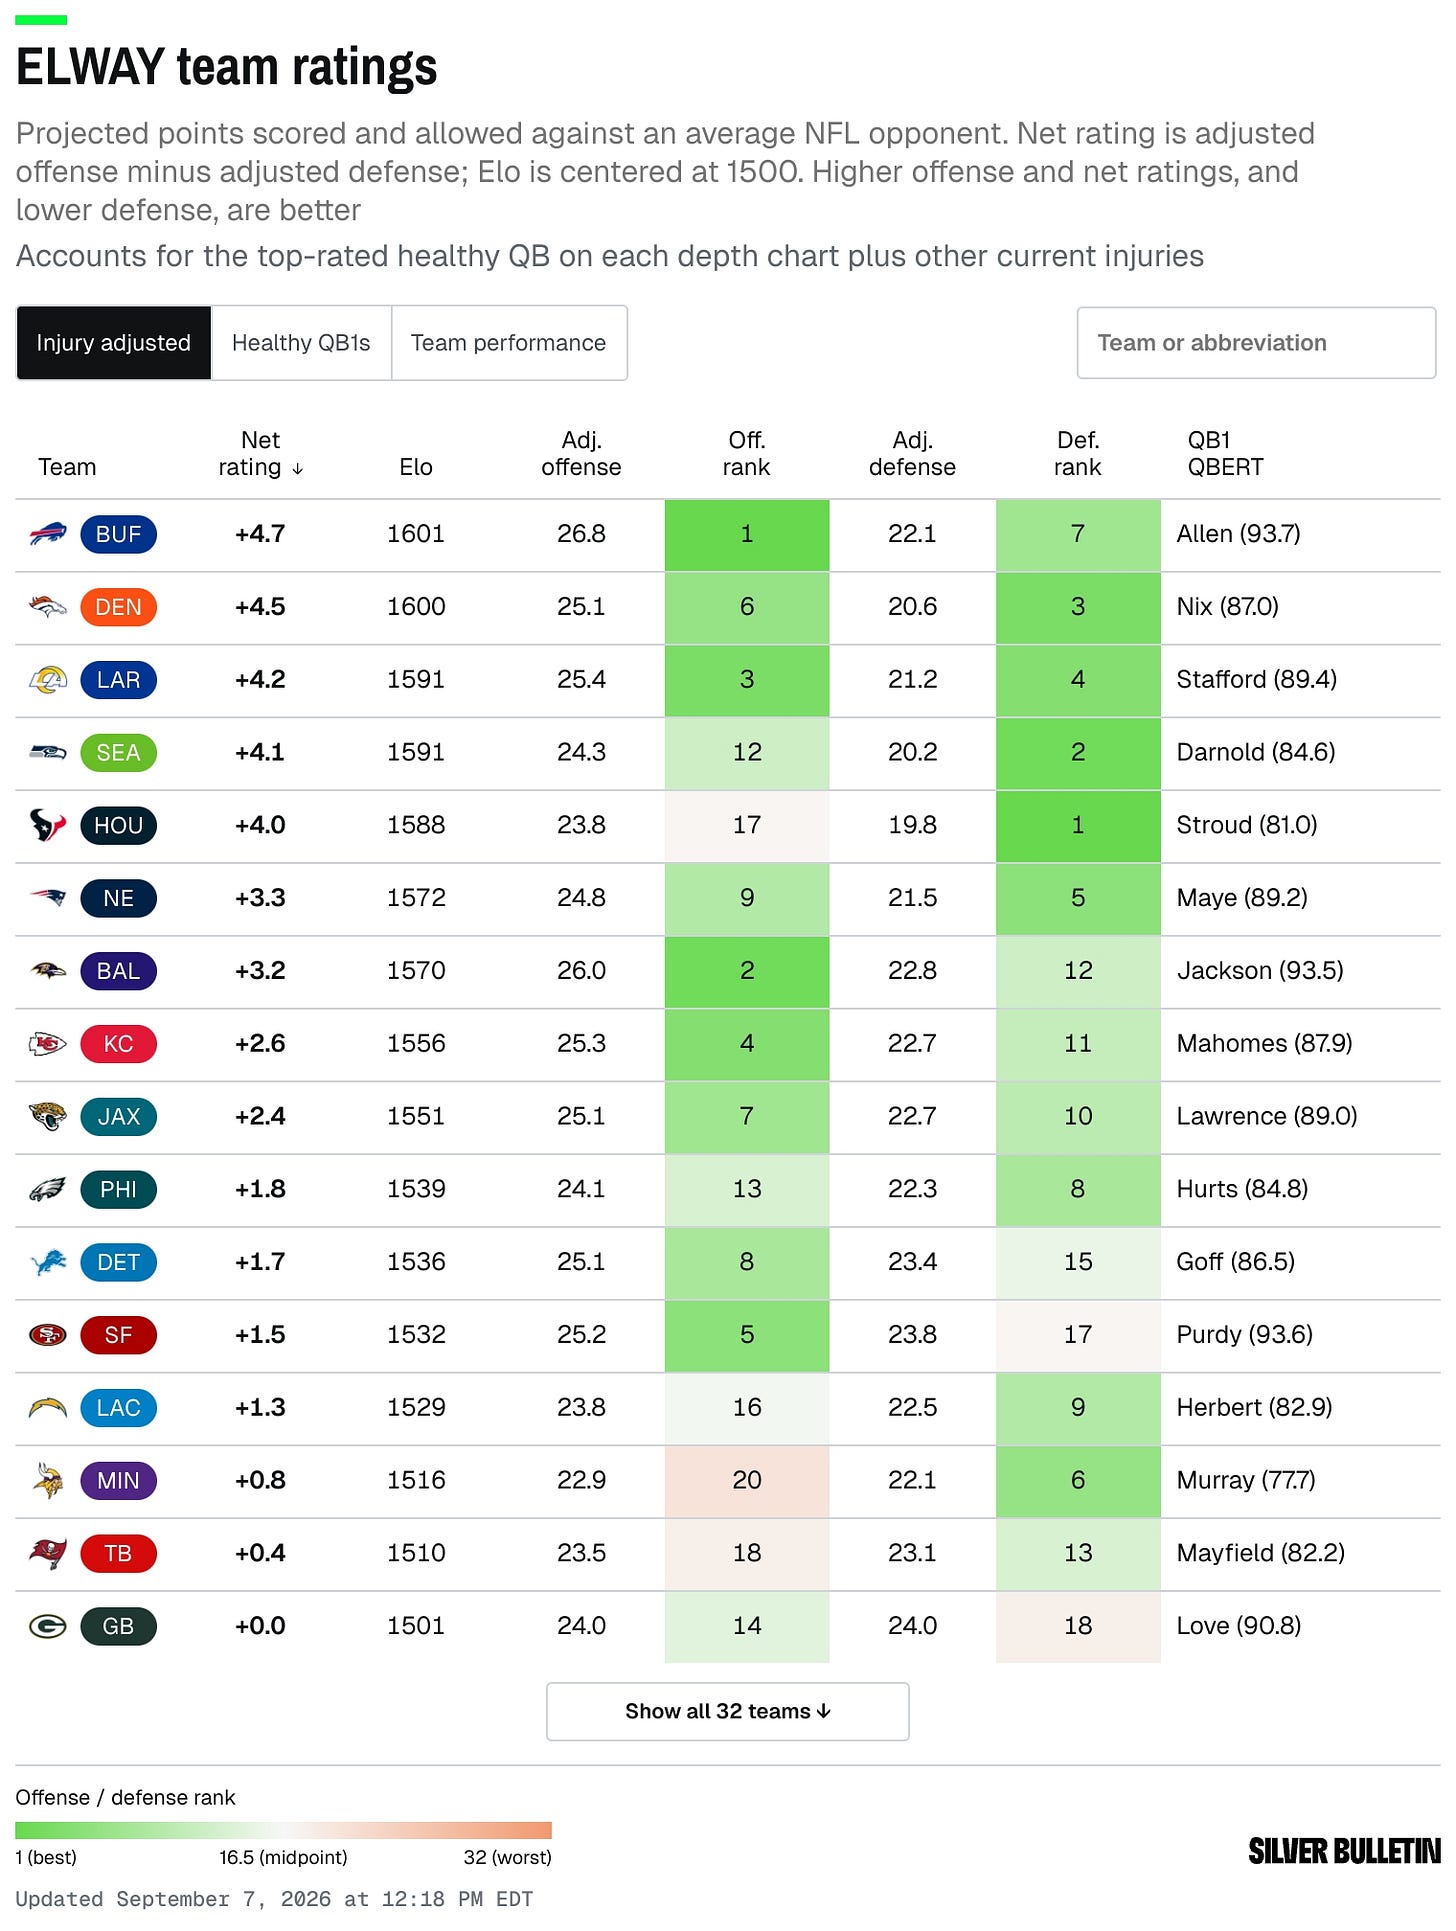
So are the Bills ELWAY’s favorite team this year? Actually it’s more complicated than that.
The default version of the ratings you see in that table includes injury adjustments, and some teams are starting out the season with a higher injury burden than others. You can click over to the “Healthy QB1” tab to see ELWAY’s injury-free ratings. By that measure, the Rams are the best team by some margin. As we’ll discuss in our season preview, however, there’s an unusually high degree of parity in the NFL this year, and sharing a division particularly hurts the Rams and Seahawks.
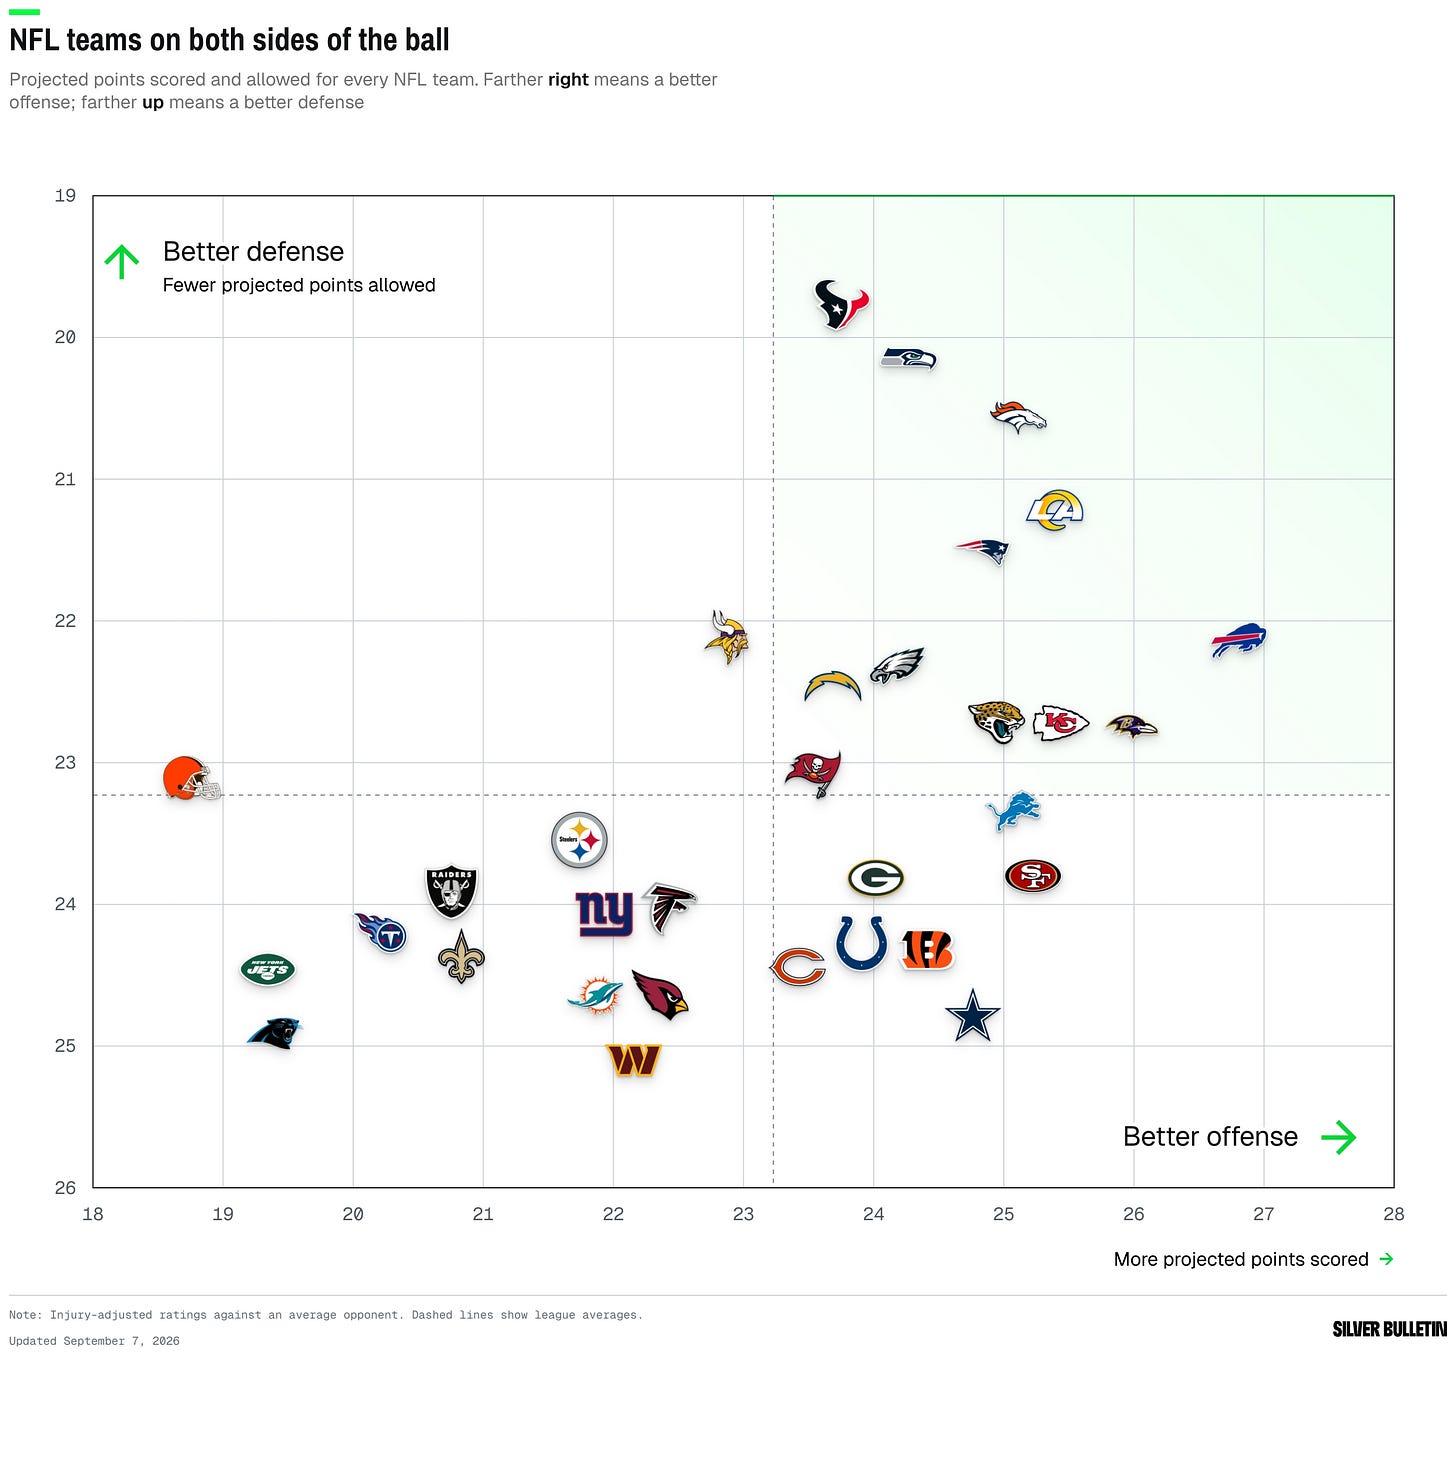
The comparison between offense and defense is also instructive. The relationship between offense and defense is complicated in the NFL because efficient offenses not only score more but leave their opponents with worse field position and take more time off the clock. Put another way, “the best defense is a good offense”. This means that teams that score more points tend to allow fewer points, and vice versa. However, there are some outliers on either side. The Texans’ strengths are particularly concentrated on defense, whereas the Cowboys have a great offense behind Dak Prescott but really struggle on the other side of the ball.
The rest of this page contains:
-
Projected W-L records for each team, including a new, detailed chart that shows the probability distribution of each team’s win totals (how likely is it that the Broncos win 11 or more games?) across 20,000 simulations.
-
Playoff, division title and Super Bowl odds, including conditional odds showing the effect on a team’s playoff chances from winning or losing its next game.
-
Detailed projections for every game of the regular season, with projected point spreads, totals (i.e. over/unders) and win probabilities for each game. There’s also a separate chart showing a distribution of simulated margins: 3-point wins and 7-point wins are particularly common, for instance.
-
Finally, we’ll add a series of graphs that track each team’s ELWAY rating from week to week, though we’ve left these off for Week 1 since the season hasn’t started yet.
The remaining features are for paid subscribers. A paid subscription also includes full access to our 2026 midterm election forecast when you sign up for ELWAY.
Here’s what you were probably waiting for: our simulated standings based on playing out the rest of the season 20,000 times, along with each team’s odds of reaching the playoffs, winning its division and winning the Super Bowl. You can also click over to the “playoff seed probabilities” tab to see a team’s likelihood of finishing with the #1 through #7 seed in each conference. The projected standings account for strength of schedule and both current and future injury risk.