
HIGHLIGHTS
-
Exploration of a silver-gold vein system at the 100%-owned Juncal Silver-Gold Project in Chile, near the Amancaya and Guanaco Mines, continued as planned, with Phase 1 completed and Phase 2 underway (program first announced 12 March 2026).
-
Significant silver-gold results from channel sampling, with continuous surface mineralisation identified across seven of eleven mapped veins. Key highlights include*:
- Javiera vein: ~1,400 m of strike; length-weighted average grade of 183 g/t AgEq over 0.7 m (25 channels) for 128 g/t·m AgEq
- Sofia vein: ~500 m of strike; length-weighted average grade of 68 g/t AgEq over 1.8 m (15 channels) for 122 g/t·m AgEq
- Koda vein: ~500 m of strike; length-weighted average grade of 71 g/t AgEq over 1.8 m (7 channels) for 128 g/t·m AgEq
* (Quoted widths are channel widths; true widths not yet determined. AgEq accumulation = average grade × average width. See Table 1.)
-
Phase 1 comprised geological mapping and >1,000 m of channel sampling in trenches using a diamond-blade rock saw.
-
Phase 2 (IP) and Phase 3 (10,000 m of RC drilling) remain on schedule for Q2/Q3 2026. No historical drilling is known to have been undertaken at Juncal, making the planned program the first known test of the vein system at depth.
Austral Gold Limited (ASX: AGD) (TSXV: AGLD) (OTCQB: AGLDF) (“Austral” or the “Company”), an established gold producer, is pleased to announce the completion of Phase 1 of its exploration program at its 100%-owned Juncal Silver-Gold Project (“Juncal” or the “Project”) in Chile.
Phase 1, announced on 12 March 2026, was the first stage of the Company’s phased exploration program. Results confirmed mineralisation at the surface across multiple veins and helped prioritise targets for follow-up work. Phase 2, comprising induced polarisation (IP) surveys, is now underway to refine drill targets ahead of a maiden drilling program in Phase 3.
Austral Gold’s CEO, Stabro Kasaneva said: “Juncal is an underexplored silver-gold project at the Paleocene belt within our northern Chile portfolio. Phase 1 has identified silver-gold mineralisation at surface across multiple veins and provides a basis for drill targeting. To date, and despite the presence of mapped mineralised structures and historical workings, the Project has not been drill tested.”
Phase 1 Exploration Results
Phase 1 (conducted during March-April 2026) advanced geological understanding of the district through the following activities:
- Detailed geological mapping to confirm lithological units, hydrothermal alteration assemblages and structural controls;
- Systematic channel sampling in trenches (>1,000 metres) using a diamond-blade rock saw, with a maximum sample length of 1.0 metre, to assess surface mineralisation and structural continuity;
- Drone-supported (airborne) magnetic surveying to enhance interpretation of subsurface geological features; and
- Processing and interpretation of multispectral satellite imagery, using combined spectral bands to identify alteration patterns and prospective structural corridors.
Channel sampling identified continuous surface mineralisation along strike across seven of the eleven mapped veins, confirming grades identified during reconnaissance and refining the structural interpretation. Selected intervals (reported at a 30 g/t AgEq cut-off) are shown in Table 1. Highlights for the three principal veins are as follows:
Samples are analysed at the internal laboratory of Austral’s Chilean subsidiary, Guanaco Compañía Minera SpA. The Company maintains a QA-QC program across all processes involving geological samples, including the insertion of standards and blanks, analytical and field duplicates, and a representative subset of pulps submitted to accredited external laboratories for independent verification. QA-QC results are reported in the accompanying JORC Table 1.
Updated Structural Interpretation
- NW-trend System: interpreted as the dominant and oldest structural corridor within the district; i.e. Gloria Vein
- NE-trend System: interpreted as a secondary system that appears to offset the Gloria system through dextral displacement; i.e., Barreales, Romané, Sofia, Carolina, Mia and Isidora veins
- ENE-trend System: interpreted as a smaller conjugate structure associated with a later-stage deformation event. i.e.: Javiera, Koda and Edith veins.
The intersection of the Gloria and Romané systems in the northwestern sector coincides with a broad zone of hydrothermal alteration and is interpreted as a priority target due to its potential to focus hydrothermal fluid flow and mineral deposition.
Tourmaline breccia bodies identified in the eastern portion of the Project, predominantly affecting intrusive units, may represent an additional component of the district’s hydrothermal evolution.
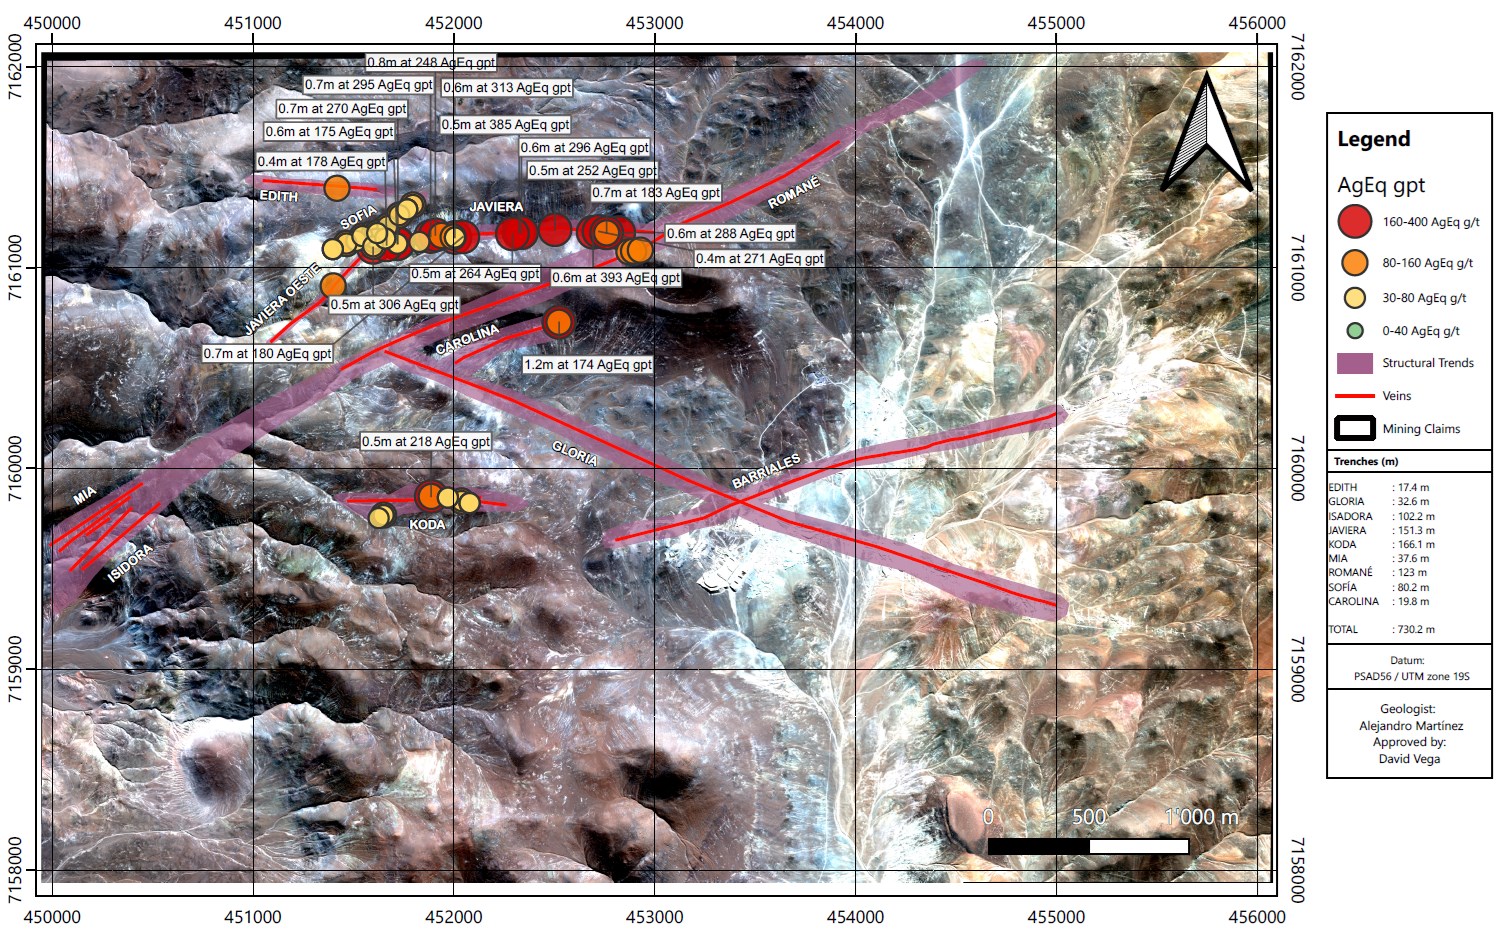
Figure 1: AgEq intercepts Juncal Trenching Program Phase 1
To view an enhanced version of this graphic, please visit:
https://images.newsfilecorp.com/files/690/302320_594f1212944da906_002full.jpg
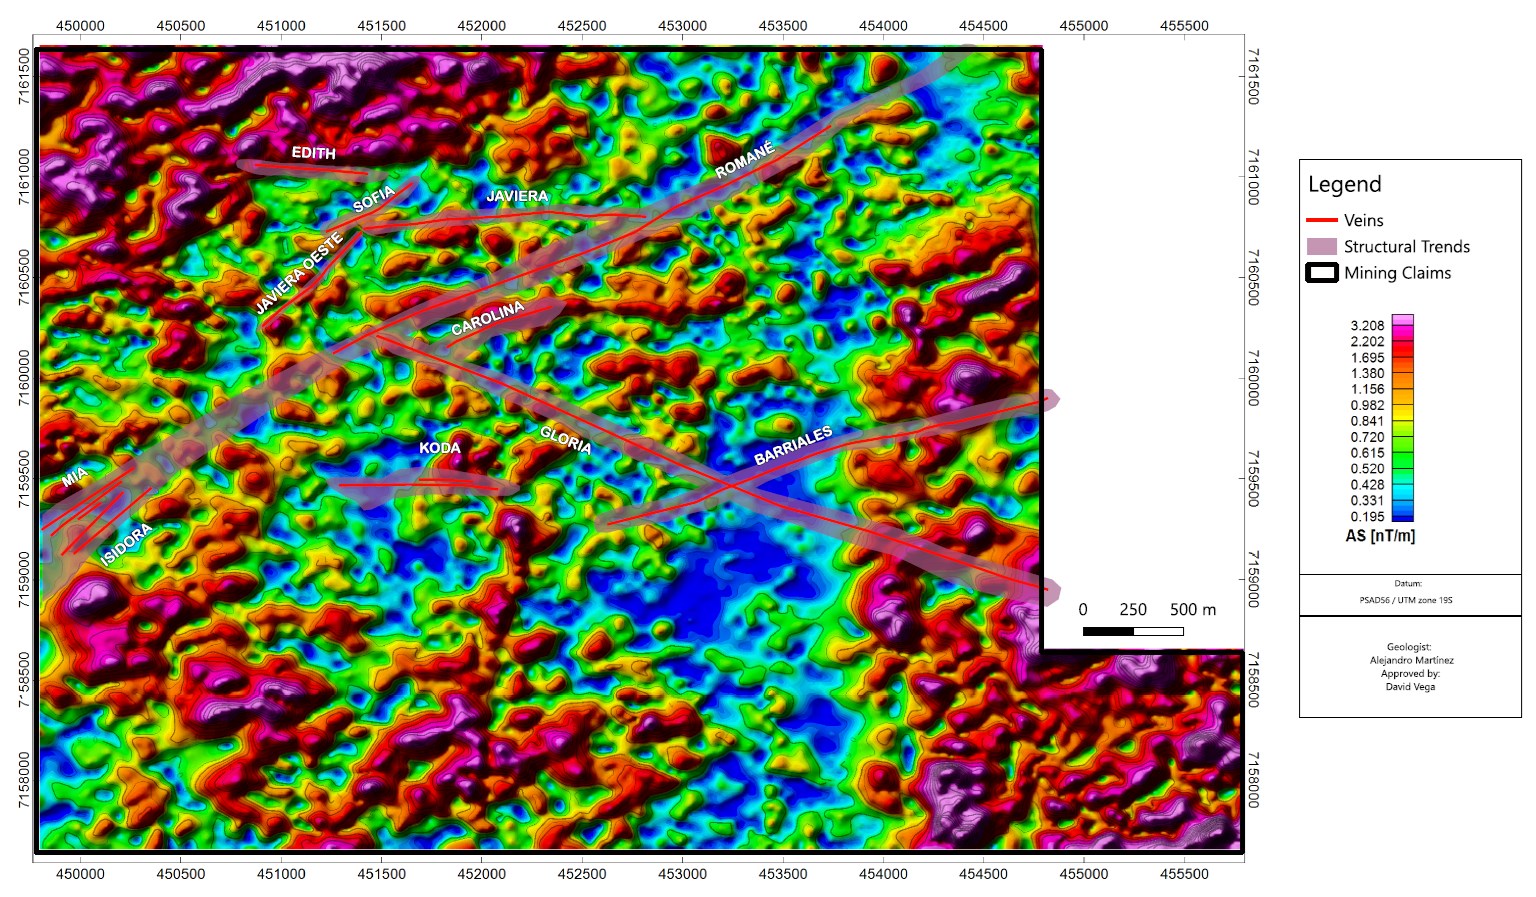
Figure 2: Drone survey magnetic analytic signal with interpreted veins and structural trends
To view an enhanced version of this graphic, please visit:
https://images.newsfilecorp.com/files/690/302320_594f1212944da906_003full.jpg
Upcoming Work
Building on the Phase 1 results, the Company is advancing the next stages of its exploration program:
Phase 2: June-August 2026
- An induced polarisation (IP) survey is planned, building on the Phase 1 drone-supported magnetic survey, to refine drill targets.
- The survey will focus on structures associated with identified geochemical anomalies in the silver-gold (Ag-Au) veins.
Phase 3: September-November 2026
- Approximately 10,000 metres of reverse circulation (RC) drilling is planned, using Company-owned equipment and operated by DV Drilling contractor company.
- Drilling is designed to test down-dip extensions of mapped structures and assess potential mineralisation below the surface, including areas not exposed at the surface.
- As no historical or modern drilling has been undertaken at Juncal, this program will represent the first systematic test of subsurface continuity of the mineralisation.
Table 1: Phase 1 Channel Sampling Results (intervals ≥ 30 g/t AgEq)
Intervals reported at a 30 g/t AgEq cut-off. “incl.” denotes higher-grade internal intervals.
Carolina Vein
| Channel ID | From (m)-To (m) | Interval (m) | AgEq (g/t) | Au (g/t) | Ag (g/t) |
| TR-CP001 | 3.8-11.02 | 7.22 | 87.4 | 0.71 | 22.4 |
| incl. | 3.8-5 | 1.2 | 174.3 | 1.56 | 32.5 |
| incl. | 7.32-8.12 | 0.8 | 114.6 | 0.98 | 25.5 |
| incl. | 9.5-11.02 | 1.52 | 179 | 1.37 | 54.4 |
Edith Vein
| Channel ID | From (m)-To (m) | Interval (m) | AgEq (g/t) | Au (g/t) | Ag (g/t) |
| TR-EDI001 | 3.6-3.9 | 0.3 | 92.6 | 0.98 | 3.5 |
Javiera Vein
| Channel ID | From (m)-To (m) | Interval (m) | AgEq (g/t) | Au (g/t) | Ag (g/t) |
| TR-JAV001 | 3.62-4.05 | 0.43 | 178.3 | 0.92 | 94.9 |
| TR-JAV002 | 5.3-8.37 | 3.07 | 50.9 | 0.45 | 9.6 |
| incl. | 5.3-5.8 | 0.5 | 146.9 | 1.19 | 38.5 |
| TR-JAV003 | 5.13-6.6 | 1.47 | 51.9 | 0.44 | 12.0 |
| TR-JAV004 | 5.12-6.64 | 1.52 | 56 | 0.5 | 10.6 |
| TR-JAV005 | 4.27-6 | 1.73 | 87.8 | 0.46 | 45.8 |
| incl. | 4.27-4.85 | 0.58 | 174.9 | 0.85 | 97.9 |
| TR-JAV006 | 6.86-7.62 | 0.76 | 82 | 0.88 | 2 |
| TR-JAV009 | 22.45-23.34 | 0.89 | 42.7 | 0.28 | 17 |
| TR-JAV010 | 5-5.8 | 0.8 | 247.5 | 0.58 | 194.8 |
| TR-JAV011 | 1.92-4.87 | 2.95 | 99.4 | 0.37 | 66.1 |
| incl. | 2.58-3.22 | 0.64 | 313.1 | 0.7 | 249.8 |
| TR-JAV012 | 2.73-3.26 | 0.53 | 385.0 | 0.66 | 324.7 |
| TR-JAV016 | 0-0.46 | 0.46 | 305.6 | 0.73 | 239.0 |
| TR-JAV017 | 0-0.47 | 0.47 | 129.4 | 1.11 | 28.7 |
| TR-JAV018 | 0-0.66 | 0.66 | 269.8 | 1.05 | 174.6 |
| TR-JAV019 | 0-0.55 | 0.55 | 287.8 | 0.38 | 253.5 |
| TR-JAV020 | 0-0.4 | 0.4 | 270.6 | 0.46 | 229.1 |
| TR-JAV021 | 0-0.58 | 0.58 | 392.5 | 0.32 | 363.7 |
| TR-JAV022 | 0-0.65 | 0.65 | 182.9 | 0.42 | 144.7 |
| TR-JAV023 | 0-0.45 | 0.45 | 84.3 | 0.17 | 68.6 |
| TR-JAV024 | 0-0.47 | 0.47 | 251.9 | 0.37 | 218.2 |
| TR-JAV025 | 0-0.55 | 0.55 | 296.2 | 0.36 | 263.4 |
| TR-JAV026 | 0-0.46 | 0.46 | 263.7 | 0.39 | 228.3 |
| TR-JAV027 | 0-0.7 | 0.7 | 179.8 | 0.75 | 111.3 |
| TR-JAV028 | 0-0.8 | 0.8 | 123.8 | 0.4 | 87.7 |
| TR-JAV029 | 0-0.66 | 0.66 | 121.7 | 0.28 | 96.3 |
| TR-JAV030 | 0-0.67 | 0.67 | 295.5 | 0.14 | 282.5 |
Koda Vein
| Channel ID | From (m)-To (m) | Interval (m) | AgEq (g/t) | Au (g/t) | Ag (g/t) |
| TR-KOD001 | 4.61-7.25 | 2.64 | 35.5 | 0.06 | 30.3 |
| TR-KOD002 | 2.03-3.8 | 1.77 | 93.3 | 0.02 | 91 |
| incl. | 3.2-3.8 | 0.6 | 129.6 | 0.03 | 126.9 |
| TR-KOD003 | 2.84-4.53 | 1.69 | 50.8 | 0.01 | 49.9 |
| TR-KOD004 | 3.03-4.4 | 1.37 | 137.4 | 0.09 | 129 |
| TR-KOD007 | 0-2.47 | 2.47 | 84.5 | 0.01 | 83.6 |
| TR-KOD008 | 1.6-3.29 | 1.69 | 66.1 | 0.05 | 61.2 |
| TR-KOD009 | 2.21-2.96 | 0.75 | 34.3 | 0.02 | 33 |
Mia Vein
| Channel ID | From (m)-To (m) | Interval (m) | AgEq (g/t) | Au (g/t) | Ag (g/t) |
| TR-MIA001 | 10.62-11.23 | 0.61 | 82.4 | 0.75 | 14.5 |
| TR-MIA002 | 5.25-6.15 | 0.9 | 41.3 | 0.16 | 26.5 |
Romane Vein
| Channel ID | From (m)-To (m) | Interval (m) | AgEq (g/t) | Au (g/t) | Ag (g/t) |
| TR-ROM001 | 3.01-3.5 | 0.49 | 102.3 | 0.32 | 73.4 |
| TR-ROM004 | 0-1.2 | 1.2 | 146.1 | 1.05 | 50.4 |
| TR-ROM005 | 0-1 | 1 | 121.4 | 0.64 | 62.9 |
Sofia Vein
| Channel ID | From (m)-To (m) | Interval (m) | AgEq (g/t) | Au (g/t) | Ag (g/t) |
| TR-SOF001 | 0.72-4.17 | 3.45 | 51.4 | 0.46 | 10.0 |
| incl. | 3.41-4.17 | 0.76 | 123 | 1.14 | 19.4 |
| TR-SOF002 | 1.52-8.73 | 7.21 | 45.3 | 0.4 | 8.8 |
| incl. | 5.02-6.31 | 1.29 | 76.9 | 0.61 | 21.4 |
| TR-SOF003 | 1.13-4.04 | 2.91 | 100.9 | 1.01 | 9.1 |
| incl. | 3.14-4.04 | 0.9 | 149.9 | 1.5 | 14 |
| TR-SOF004 | 2.74-4.05 | 1.31 | 69.5 | 0.5 | 23.6 |
| incl. | 2.74-3.27 | 0.53 | 116.7 | 0.8 | 44.5 |
| TR-SOF005 | 1.25-7.76 | 6.51 | 59.2 | 0.55 | 9.4 |
| TR-SOF006 | 4.06-7.38 | 3.32 | 58 | 0.43 | 18.5 |
| TR-SOF007 | 4.1-6.86 | 2.76 | 82.9 | 0.56 | 32.3 |
| incl. | 4.1-4.88 | 0.78 | 108.2 | 0.58 | 55.9 |
| TR-SOF008 | 4.83-8.83 | 4 | 65.4 | 0.68 | 3.3 |
| TR-SOF009 | 0-0.87 | 0.87 | 61.2 | 0.5 | 15.7 |
| TR-SOF010 | 0-1.29 | 1.29 | 52.3 | 0.3 | 24.7 |
| TR-SOF011 | 0-2.18 | 2.18 | 69.9 | 0.55 | 19.5 |
| TR-SOF012 | 0-0.7 | 0.7 | 65.7 | 0.27 | 40.9 |
| TR-SOF013 | 0-1.6 | 1.6 | 56.9 | 0.35 | 24.8 |
| TR-SOF014 | 0-1 | 1 | 51.8 | 0.27 | 27 |
| TR-SOF015 | 0-0.7 | 0.7 | 48.5 | 0.4 | 12.4 |
Widths are channel (sample) lengths, not necessarily true widths; true widths are interpreted to be lower. AgEq = silver equivalent. Results reported in accordance with JORC 2012 and NI 43-101. Bold rows denote standout intervals.
Silver equivalent (AgEq) is calculated as: AgEq (g/t) = Ag (g/t) + [Au (g/t) × (Au price ÷ Ag price)]. AgEq assumes Austral Gold long-term metal prices of US$27.5/oz silver and US$2,500/oz gold (a gold-to-silver ratio of approximately 90.9:1). Metallurgical recoveries are assumed equal for all metals, as no metallurgical test work has been completed; recovery assumptions are therefore preliminary and may not be realised. It is the Company’s opinion that all elements included in the metal equivalent calculation have a reasonable potential to be recovered.
Widths quoted in the highlights (e.g. 0.4-1.5 m for Javiera) are the mineralised channel widths used to calculate the reported length-weighted average grades. The “Interval (m)” column in Table 1 shows the full channel sample length from “From” to “To”, which may be greater where lower-grade material is included within the sampled interval. The two therefore refer to different measures and are not directly comparable.
Juncal Background
Austral acquired Juncal from TSX- and NASDAQ-listed SSR Mining in 2016. The Project forms part of the Company’s exploration portfolio in the Paleocene Belt of northern Chile and covers approximately 2,100 hectares. It is located about 70 km south of the Guanaco Mine and 35 km east of the 100%-owned Amancaya Mine. The Project is subject to a 1% Net Smelter Return (NSR) held by Nasdaq- and TSXV-listed Elemental Royalty Corporation.
The Juncal district is underlain by volcanic and sedimentary rocks of the Middle Eocene Pampa Lorca Formation, which unconformably overlie Upper Paleocene basaltic andesites of the Pampa Rubia Formation. This stratigraphic sequence is intruded by Late Eocene intermediate- to felsic intrusive bodies.
Tourmaline breccia bodies have also been identified in the eastern portion of the project area, where they predominantly affect intrusive units and may be an important component of the district’s hydrothermal evolution.
Competent Person
The information in this announcement that relates to exploration results is based on, and fairly represents, information and supporting documentation prepared by Marcos Valencia, who is a Qualified Person as defined by NI 43-101 and a Competent Person as defined by the Australasian Code for Reporting of Exploration Results, Mineral Resources and Ore Reserves (JORC Code 2012).
Mr Valencia is a Fellow of the Australasian Institute of Mining and Metallurgy (FAusIMM), No. 323676 and a Registered Member of the Chilean Mining Commission (No. 432). Mr. Valencia is an employee of Austral Gold Limited and is not independent of the Company. Mr. Valencia has sufficient experience that is relevant to the style of mineralisation, type of deposit under consideration, and to the activity being undertaken, to qualify as a Competent Person under the JORC Code 2012 and as a Qualified Person under NI 43-101.
Mr Valencia consents to the inclusion in this announcement of the matters based on his information in the form and context in which it appears.
About Austral Gold
Austral Gold is a growing gold and silver mining producer building a portfolio of quality assets in the Americas based on three strategic pillars: production, exploration and equity investments. Austral continues to lay the foundation for its growth strategy by advancing its attractive portfolio of producing and exploration assets. Under its equity investments pillar, Austral holds shares in ASX-listed Unico Silver. For more information, please visit the Company’s website at www.australgold.com.
Neither TSX Venture Exchange nor its Regulation Services Provider (as that term is defined in the policies of the TSX Venture Exchange) accepts responsibility for the adequacy or accuracy of this release.
Release approved on behalf of the Board by the Chief Executive Officer, Stabro Kasaneva.
For additional information please contact:
Forward-Looking Statements
Statements in this news release that are not historical facts are forward-looking statements. Forward-looking statements are statements that are not historical and consist primarily of projections and statements regarding future plans, expectations and developments. Words such as “expects”, “intends”, “plans”, “may”, “could”, “potential”, “should”, “anticipates”, “likely”, “believes” and words of similar expressions are intended to identify forward-looking statements. The forward-looking statements in this news release include, but are not limited to, statements regarding the Company’s planned exploration activities, the expected timing and phases of the exploration program, the interpretation of exploration results, potential mineralisation and its continuity at depth, anticipated outcomes of exploration work, planned geophysical surveys, future drilling plans and drill targeting, assumed metallurgical recoveries, and the Company’s strategic objectives.
All of these forward-looking statements are subject to a variety of known and unknown risks, uncertainties and other factors that could cause actual events or results to differ from those expressed or implied, including, without limitation, uncertainty of exploration programs, development plans and cost estimates, commodity price fluctuations; political or economic instability and regulatory changes; currency fluctuations, the state of the capital markets, uncertainty in the measurement of mineral resources and reserves; and other risks and hazards related to the exploitation and development of mineral properties, as well as the availability of capital. You are cautioned that the foregoing list is not exhaustive of all factors and assumptions which may have been used. Austral cannot assure you that actual events, performance or results will be consistent with these forward-looking statements, and management’s assumptions may prove to be incorrect. Austral’s forward-looking statements reflect current expectations regarding future events and operating performance and speak only as of the date hereof and Austral does not assume any obligation to update forward-looking statements if circumstances or management’s beliefs, expectations or opinions should change other than as required by applicable law. For the reasons set forth above, you should not place undue reliance on forward-looking statements.
JORC Code, 2012 Edition – Table 1 report template
Section 1 Sampling Techniques and Data
(Criteria in this section apply to all succeeding sections)
| Criteria | JORC Code explanation | Commentary |
| Sampling techniques |
|
A trench sampling program was conducted. The operational procedure involved clearing and excavating the area to expose a clean rock face. On this exposed wall, a diamond-blade saw was used to cut parallel lines into the rock, defining the channel boundaries. The sample was then chipped out using a pneumatic hammer, ensuring the fragmented material fell directly into a chute and into the sample bag for secure containment. This trench sampling program covered an area of 2.8 x 2 km. Trenches were excavated to a depth of 1.00 to 1.5 m, with 9 to 12 samples collected per sampling point. Each primary sample weighed approximately 10 to 15 kg. As part of the quality control protocol, field duplicates were inserted at an approximate rate of 1 every 20 samples (5%), for a total of 31 field duplicate samples. Upon completion of the program, a total of 602 samples were generated from 53 trenches and analysed for Gold (Au), Silver (Ag), Copper (Cu), Lead (Pb), Zinc (Zn), and Antimony (Sb).
Within the program, 29 samples were collected from 25 distinct sampling points using the chip-channel sampling method. For this procedure, the channel boundary was geometrically outlined on the rock face, and the material was manually chipped out using a hammer and chisel to ensure the representativeness of the recovered fragments. In addition, field reconnaissance is being conducted, where a geologist describes lithologies, alterations, and mineralogy found at various points recorded with a GPS. At these geological control points, representative samples are collected for distinct investigation workflows: one fraction is dispatched to the chemical laboratory for routine analytical assays (metal grades), while selected fragments are prioritised for mineralogical characterisation, including the preparation of thin and polished sections for petrographic and mineralogic studies. |
| Drilling techniques |
|
To date, no drilling campaigns have been conducted within the project area. Consequently, the data obtained through this trench sampling program constitutes the primary source of geological information, serving as the baseline for alteration and mineralisation models, as well as for the subsequent planning of drill targets. |
| Drill sample recovery |
|
No core drilling (diamond or reverse circulation) has been conducted within the project area. Therefore, recovery assessment focuses exclusively on surface trench samples (saw-cut channel and chip-channel sampling). Sample recovery was recorded and assessed primarily through volumetric and gravimetric (weight) control. Prior to sampling, channels were geometrically outlined on the exposed clean rock face to maintain consistent dimensions (width and depth) across the 1.00 to 1.5 m depth intervals. Each primary sample collected was weighed at the site before dispatching, ensuring that the final material weights consistently fell within the targeted technical range of approximately 10 to 15 kg. |
| Logging |
|
Logging was predominantly quantitative in nature. All exposed trench faces and sample channels were geologically logged in detail. The logging recorded key primary features including lithology, structural orientation, mineralogy style, mineralogy, and hydrothermal alteration assemblages typical of epithermal systems.
All sample logging has been supervised by experienced geologists. Consequently, while the data are appropriate for conceptual geological modelling, supplementary diamond core drilling (DDH) providing undisturbed subsurface samples will be required in the future to fully support formal Mineral Resource estimates, advanced geotechnical mining studies, and comprehensive metallurgical recovery testing. |
| Sub-sampling techniques and sample preparation |
|
Sub-Sampling Technic:
No core drilling (diamond core) has been conducted within the project area to date. All samples originate from surface trenching campaigns. Consequently, this criterion is not applicable to the current stage of the project. All collected samples are surface non-core samples, categorised into two types: mechanical saw-cut channel samples (602 samples from 53 distinct locations) and manual chip-channel samples (29 samples from 25 distinct locations). All trench walls and channels were sampled under strictly dry conditions. Sampling during rain or on wet surfaces was avoided to prevent the loss of fines and to eliminate potential cross-contamination. No downhole non-core splitting methods (such as riffle splitting or rotary splitting of reverse circulation drill chips) were performed in the field. The entire rock material from each channel was collected immediately into secure plastic sample bags at the site, yielding a primary sample weight of approximately 10 to 15 kg. Sub-sampling occurred later under control conditions at the analytical laboratory. Sample Preparation Technique: Drying (4 hours at 105° C), crushing to 85% passing 10 mesh, splitting and pulverizing 1 Kg to 85% passing #200 Mesh, and splitting into two pulps with approximately 200 g each. The primary lab was the Guanaco Mine laboratory. To ensure high in-situ representativeness, all trenching points were thoroughly excavated and cleared of soil and weathered overburden to expose pristine rock faces. For the primary grid, a diamond-blade saw was used to cut precise, parallel lines into the rock face to guarantee uniform sample geometry and volume. A specialised sampling chute was continuously placed directly beneath the channels during the chipping process (utilizing pneumatic hammers and manual hammer/chisel methods), ensuring that 100% of the fragmented material, specifically the critical fine fractions, were recorded directly into the sample bags without loss or ground contamination. In addition, field duplicates were systematically inserted into the sample stream at an approximate insertion rate of 1 every 20 samples (5% insertion rate). A total of 31 field duplicates were analysed alongside the routine samples. Statistical evaluation of these field duplicates via scatter plots and Relative Absolute Difference (HARD) calculations demonstrates strong correlation and reproducibility, confirming the representative and unbiased nature of the in-situ extraction process. |
| Quality of assay data and laboratory tests |
|
(See Mechanical Preparation Procedure)
The analytical techniques used by the primary laboratory (GCM) are standard and appropriate for evaluating epithermal and base-metal mineralisation styles within the project area. Gold (Au) is analysed by fire assay using a 30 g charge. For samples returning lower grades (0.01 to 6.66 g/t Au), an Atomic Absorption Spectroscopy (AAS) finish is applied, while higher-grade samples (6.66 to 99.99 g/t Au), are analysed using a gravimetric finish. Fire assay is considered a total digestion technique for gold, and is generally regarded as providing complete extraction of gold from the sample matrix. Silver (Ag), copper (Cu), zinc (Zn), and antimony (Sb) were analysed using AAS. Initially, the primary laboratory GCM used 4 ácid-ASS for Ag, Cu, Zn and Sb) digestion method to capture certain refractory phases concentrations. However, following an external laboratory element analysis (36 elements ICP-OES and 4 ácid-ASS for Ag, Cu, Zn and Sb), the limitations of the aqua regia method in recovering metals from certain refractory phases were identified. The protocol defined was a 4-acid digestion (hydrofluoric, nitric, perchloric, and hydrochloric acids). A 4-acid digestion is considered a near-total digestion technique, capable of dissolving nearly all mineral matrices, including highly refractory silicates and complex sulfosalts. Following the optimisation of the GCM protocol, a comprehensive re-analysis program was ordered for 100% of the trench and chip-channel samples, ensuring that the entire analytical database is homogenized under the superior 4-acid digest standard. No handheld XRF instruments, portable spectrometers, or geophysical tools were used to determine the analytical grades for the 602 samples or the 29 chip-channel samples. All reported grades rely exclusively on formal wet-chemistry and destructive laboratory techniques (Fire Assay, 4-Acid Digestion, ICP-OES, and AAS) in accordance with industry best practices. Consequently, parameters regarding instrument calibration factors or reading times for field sensors are not applicable to this dataset. Field duplicates were systematically inserted into the sample stream at 5% insertion rate. A total of 31 field duplicates were analysed alongside the routine samples. The statistical reproducibility of these field duplicates confirmed precision in sampling and crushing. To independently validate the primary laboratory’s performance, a subset of 20 representative samples was dispatched to Cotecna-AGS (ID: CL26-1904), an external laboratory. Cotecna-AGS performed a comprehensive 36-element suite (PR-01 V.00.) via Inductively Coupled Plasma Optical Emission Spectrometry (ICP-OES). Additionally, Cotecna-AGS analysed Ag, Cu, Zn, and Sb using Atomic Absorption (AA) following a 4-acid digestion (PR-19 V.00 DT-AAS 2g/100ml). Resolution of Analytical Bias: A comparative analysis between the primary laboratory (GCM) and the certified external lab (Cotecna-AGS) initially revealed a significant discrepancy in Silver {Ag} values, attributable to GCM’s use of aqua regia digestion compared to Cotecna’s 4-acid digestion. To address this, GCM’s analytical protocol was updated to adopt the 4-acid digestion method. Following implementation, a scatter plot comparison yielded a strong correlation, with a coefficient (R²) of 0.9884) and an average Relative Percent Difference (RPD) for silver of approximately 7%. Subsequently all trench and chip-channel samples were re-analysed using the updated method to ensure consistency across the dataset. Based on the assay results , and a strong correlation with the external laboratory, the data are considered to demonstrate acceptable levels of both accuracy and precision for exploration purposes. The correspondent QP considers the QAQC programs to meet industry standard practice at the time of completion and the results to be acceptable. |
| Verification of sampling and assaying |
|
Significant anomalous intervals and mineralised channels identified during the trenching and chip-channel campaigns were visually inspected and verified in the field by Senior Exploration Geologists and the Project Manager.
Independent verification was structurally achieved through the external umpire assay program. A subset of 20 representative samples was dispatched to the independent laboratory Cotecna-AGS. The comparison of their 4-acid digestion AA and ICP-OES results against the primary laboratory’s (GCM) data provided a blind, external validation of the mineralised intervals, successfully triggering the optimisation of the project’s silver assaying methodology. No drilling campaigns have been conducted within the project area to date. Consequently, the concept of “twinned holes” is not applicable to this stage of exploration. All primary field data, including trench coordinates, channel dimensions, sample IDs, structural orientations (strike/dip), and qualitative geological descriptions (lithology, alteration, sulphide percentages), were recorded directly in the field using standardized paper logging sheets. Field notes were transcribed daily into a centralized electronic master spreadsheet. The Project Geologist cross-checked 100% of the digital data entries against the original physical logs and high-resolution trench photographs prior to database integration. All primary field data, including trench coordinates, channel dimensions, sample IDs, structural orientations (strike/dip), and qualitative geological descriptions (lithology, alteration, sulphide percentages), were recorded directly in the field using standardized paper logging sheets and maps, and then manually logged into the database. Laboratory assay certificates and the centralized master database are stored securely on a cloud-based database network. The designated database geologist manually integrates all laboratory assay results into this cloud system, performing comprehensive, multi-layered quality checks to eliminate typing mistakes and ensure absolute database integrity. An external check program of 20 samples sent to Cotecna-(AGS) (using a 4-acid digestion) yielded a correlation coefficient (R²) of 0.9884) in the scatter plot and reduced the average Relative Percent Difference (RPD) between the labs to 7%. A total of 30 analytical duplicates (laboratory pulp duplicates) for gold (Au) and 50 duplicates for silver (Ag) were analysed. Duplicate assay results show a high degree of correlation, with coefficients of determination( R²) of 0.9998 for Au and R² = 0.9997 for Ag, indicating strong repeatability. Thompson-Howarth precision analysis indicates high analytical precision, with values of 96.06% for Au and 98.34% for Ag. Additionally, 33 coarse reject duplicates were analysed for gold (Au), demonstrating a high degree of correlation, with a coefficient of determination of (R²) of 0.9988), indicating good repeatability and consistency at the crushing stage. To monitor potential cross-contamination during sample preparation and analysis, coarse and pulp blanks were inserted into the sample stream. This included 46 blank analyses for gold (Au) and 12 for silver (Ag). Results indicate that blank values were consistently below five times the lower limit of detection (LOD) (Au = 0.01 g/t; Ag = 1 g/t), suggesting no material contamination during sample preparation or analytical procedures. Standard accuracy was rigorously evaluated by measuring the percentage of analytical values falling within the acceptable ±2 and ±3 standard deviation (σ) thresholds. Certified reference materials STD-OXE-101 (34 analyses) and STD-IN-M639-328 (34 analyses) returned results entirely within the ±2σ and ±3σ limits, i indicating acceptable analytical accuracy and precision.. For silver (Ag) standards, certified reference materials STD-322-158 (17 analyses), STD-IN-M126-47 (13 analyses), and STD-IN-M68-18 (10 analyses) were used. All standards returned results within acceptable industry tolerance limits, with approximately 92.5% of results falling within ±2σ and ±3σ control limits, indicating no significant analytical bias. No mathematical adjustments, multipliers, or factoring were applied to any assay values; below-detection-limit results are strictly recorded as half the lower detection limit (e.g., <0.01 g/t Au is entered as 0.005 g/t Au) for statistical consistency. The results of the QAQC program indicate that for Ag, it has a precision of 98% and an accuracy of 92.5%, and for Au, it has a precision of 96% and an accuracy of 99%. |
| Location of data points |
|
The coordinate system used in the Juncal project is the PSAD56 Datum La Canoa. The channels and trenches were surveyed using a Total Station. |
| Data spacing and distribution |
|
All coordinates, lengths, and orientations of the sampled lines were recorded using total station to ensure spatial integrity for this stage of exploration.
The current data spacing and distribution are sufficient to establish a strong understanding of surface geological continuity, structural controls, and the initial grade distribution of the mineralisation. The tight sampling intervals within individual trenches clearly define the geometry and boundaries of the mineralised structures. The current dataset serves as a high-quality foundation to define geometry and targets. Subsurface diamond core or reverse-circulation (RC) drilling campaigns will be required in future phases to confirm the depth extension of the mineralisation and to provide the 3D data density necessary for formal resource estimation procedures. No sample compositing has been applied to the primary assay data. |
| Orientation of data in relation to geological structure |
|
All trenches and chip-channel lines were systematically laid out and cut perpendicular 90° to the structural strike of the veins and altered zones. This ensures that the sampled intervals represent the true horizontal thickness of the surface mineralisation, preventing any artificial stretching of grades.
The project is currently in the surface geochemistry stage; no drilling campaigns have been conducted to date. The perpendicular orientation of the surface channel sampling guarantees that no material sampling bias has been introduced to the reported results. |
| Sample security |
|
Samples were under continuous supervision by the project geology team from the moment of collection at the trenches to final dispatch.
Collected material was immediately placed into high-density plastic sample bags, tagged with unique sample numbers, and securely sealed with single-use, tamper-evident plastic zip ties. Sealed bags were transported directly from the field site to the certified laboratory (GCM) using company-owned vehicles driven by authorized staff. Upon arrival, the laboratory verified that all security seals were intact and officially logged the samples into their tracking system. No security breaches or tampering incidents were recorded. |
| Audits or reviews |
|
No external audits or independent reviews of the sampling techniques, protocols, or historical data have been undertaken for the project to date.
The database and current sampling methodologies are managed under internal peer reviews and standard operating procedures enforced by the project’s technical team. |
Section 2 Reporting of Exploration Results
(Criteria listed in the preceding section also apply to this section.)
| Criteria | JORC Code explanation | Commentary |
| Mineral tenement and land tenure status |
|
Austral acquired Juncal from TSX- and NASDAQ-listed SSR Mining in 2016. The Project forms part of the Company’s exploration portfolio in northern Chile and covers approximately 2,100 hectares. It is located about 70 km south of the Guanaco Mine and 35 km east of the 100%-owned Amancaya Mine. The Project is subject to a 1% Net Smelter Return (NSR) held by Nasdaq- and TSXV-listed Elemental Royalty Corporation. |
| Exploration done by other parties |
|
No other substantial exploration data has been reviewed by the corresponding QP that would be considered meaningful or material mineralisation |
| Geology |
|
The Juncal deposit is situated within the Paleocene metallogenic belt. This belt has proven fertile for epithermal deposits of both High-Sulfidation (HS) and Low-Sulfidation (LS) styles. Juncal is classified as an Intermediate Sulfidation (IS) epithermal deposit. While the Paleocene belt commonly hosts both classic High-Sulfidation (HS) and Low-Sulfidation (LS) styles, Juncal displays the distinct mineralogical, fluid-inclusion, and alteration assemblages characteristic of the intermediate-sulfidation subtype. Mineralisation at Juncal occurs primarily as structurally controlled quartz-carbonate-base metal sulfide veins, hydrothermal breccia zones, and associated stockworks. The mineralised structures typically exhibit classic epithermal textures, including crustiform-colloform banding, cockade structures, and bladed calcite replacement. The economic mineralogy consists of native gold (Au) and silver (Ag) sulfosalts, associated with a diagnostic intermediate sulfidation sulfide assemblage including sphalerite, galena, stibnite and chalcopyrite, hosted within pervasive phyllic (quartz-sericite-pyrite) to argillic alteration halos. |
| Drill hole Information |
|
The exclusion of a drill hole information table is fully justified because no drilling has taken place. The current exploration results are derived exclusively from surface trenching and chip-channel campaigns. This exclusion does not detract from the understanding of the report, as the surface spatial distribution, coordinates, and geometry of the sampled intervals have been thoroughly detailed in the preceding sections. The project remains in a pre-drilling, surface-geochemical evaluation phase. |
| Data aggregation methods |
|
Length-weighted averaging was applied to calculate the average grade for each trench or channel interval. No top-cutting or minimum/maximum grade truncations (cap grades) have been applied to the raw assay data, ensuring that the full variability of the high-grade components remains transparent at this exploration stage. Where continuous surface channels include localised, narrow zones of high-grade mineralisation within a broader halo of lower-grade material, results are reported as length-weighted composites. Internal dilution (intervals of lower grade or unmineralised waste within a channel) was restricted to a maximum of 1.0 m continuous length to avoid excessive dilution and to maintain the distinction between potentially separate mineralised structures. Metal equivalent values (AgEq) are used or reported in this document. All gold and silver exploration results from the surface campaigns are stated independently as absolute elemental grades (Au g/t, and Ag g/t) and AgEq = Au*(2500/27.5) + Ag (Long Term Prices used to calculate AgEq were Au US$ 2,500/oz and Ag US$27.5/oz). |
| Relationship between mineralisation widths and intercept lengths |
|
The geometry and orientation of the mineralised structures at the surface are well understood through detailed structural mapping. Because all exploration results reported at this stage are derived from surface trenches and chip-channel lines cut systematically at a right angle (90°) to the mapped structural strike, the reported intercept lengths directly represent the true horizontal width of the mineralisation at the surface. Not applicable. No subsurface drilling has been conducted to date; therefore, no “down-hole lengths” are reported. |
| Diagrams |
|
All high-resolution exploration plan maps and interpretive geological cross-sections were generated directly from the geological and structural data collected during the field campaigns. These visual models outline the localized lithologies, structural traces of the mapped quartz vein systems, and the precise boundaries of the hydrothermal alteration halos superimposed with geophysical anomalies. They accurately represent the spatial distribution, horizontal lengths, and individual analytical results for all surface chip-channel and trenching lines measured in the field, complemented by schematic cross-sections that display the projected dip and geometric behaviour of the core structures. Additionally, comprehensive tabulations detailing the coordinates, physical sampling widths, and length-weighted composite grades for all significant surface intersections were compiled entirely from these field datasets to provide a clear spatial baseline for ongoing exploration targeting. |
| Balanced reporting |
|
The definition of the values of economic interest has been established based on proxies and the relevant experience of the QP, supported by expert personnel from AGL, where reasonable assumptions are made about how these bodies could benefit, which could contain mineralisation with continuity and must be verified through future investments in drilling. |
| Other substantive exploration data |
|
No other substantial exploration data has been reviewed by the corresponding QP that would be considered meaningful or material. |
| Further work |
|
Planned future work will test the depth and lateral continuity of the mineralised structures. This includes a Phase 3 Reverse Circulation (RC) campaign of approximately 10,000 m, along with continuous trench extensions along strike and targeted geophysical surveys (induced polarisation and magnetics) to support drill targeting. |
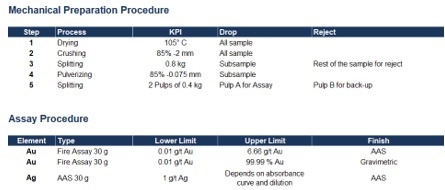
Mechanical Preparation Procedure
To view an enhanced version of this graphic, please visit:
https://images.newsfilecorp.com/files/690/302320_jroc1_enhanced.jpg
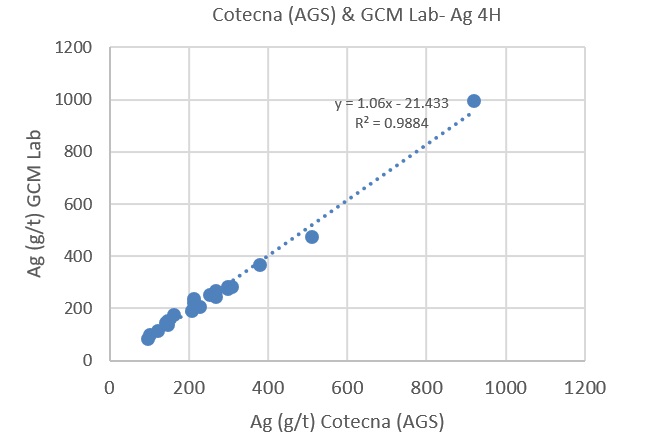
Cotecna (AGS) & GCM Lab- Ag 4H
To view an enhanced version of this graphic, please visit:
https://images.newsfilecorp.com/files/690/302320_jroc2_enhanced.jpg
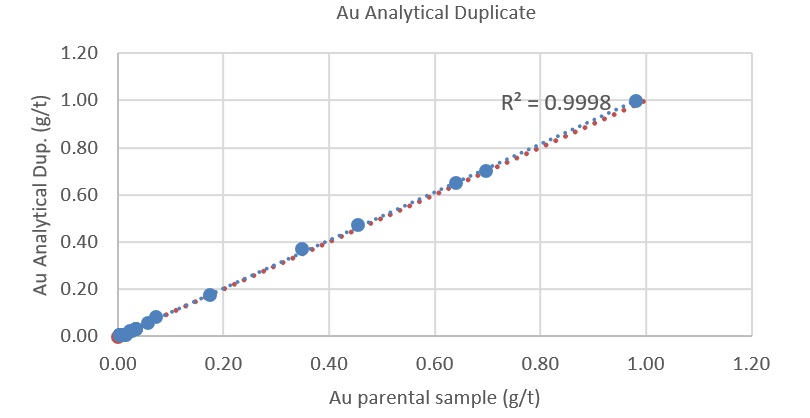
Au Analytical Duplicate
To view an enhanced version of this graphic, please visit:
https://images.newsfilecorp.com/files/690/302320_jroc3_enhanced2.jpg
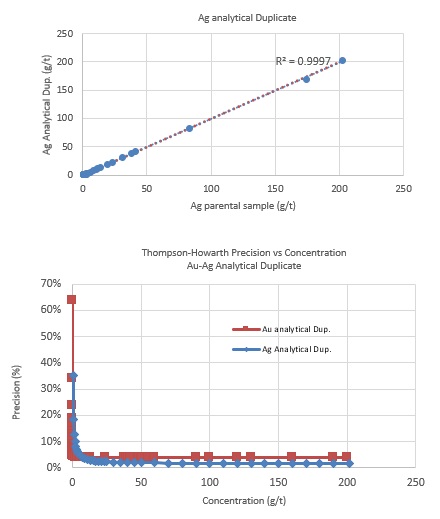
Ag analytical Duplicate and Thompson-Howarth Precision vs Concentration Au-Ag Analytical Duplicate
To view an enhanced version of this graphic, please visit:
https://images.newsfilecorp.com/files/690/302320_jroc4_enhanced.jpg
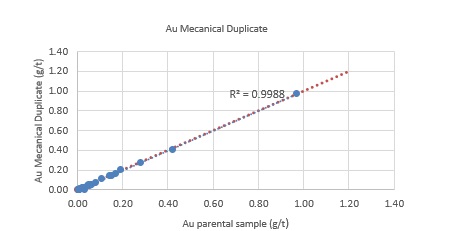
Au Mecanical Duplicate
To view an enhanced version of this graphic, please visit:
https://images.newsfilecorp.com/files/690/302320_jroc5_enhanced.jpg
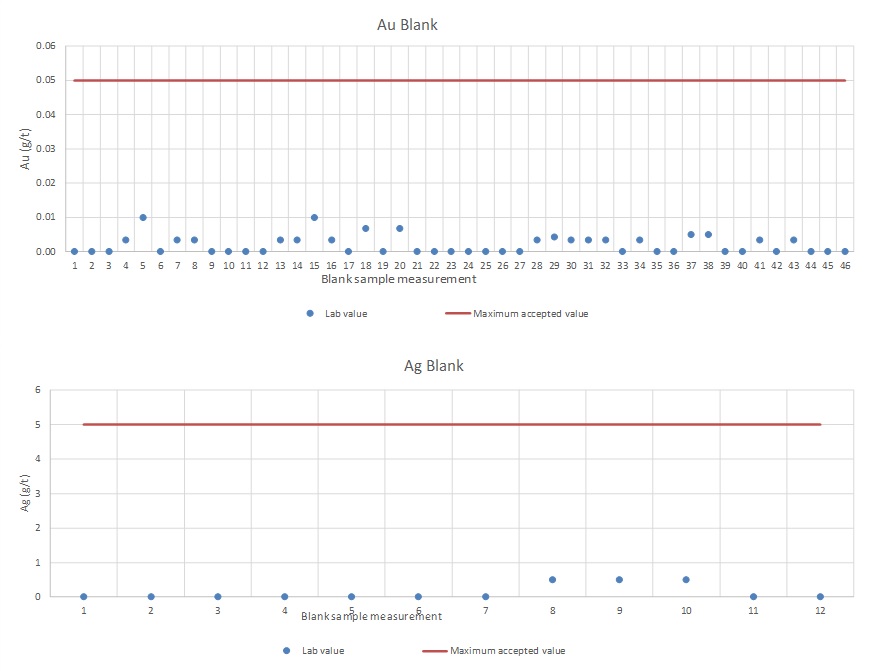
Au Blank and Ag Blank
To view an enhanced version of this graphic, please visit:
https://images.newsfilecorp.com/files/690/302320_jroc6_enhanced.jpg

STD-OxE-101 Au and STD-IN-M639-328 Au
To view an enhanced version of this graphic, please visit:
https://images.newsfilecorp.com/files/690/302320_jroc7_enahanced.jpg
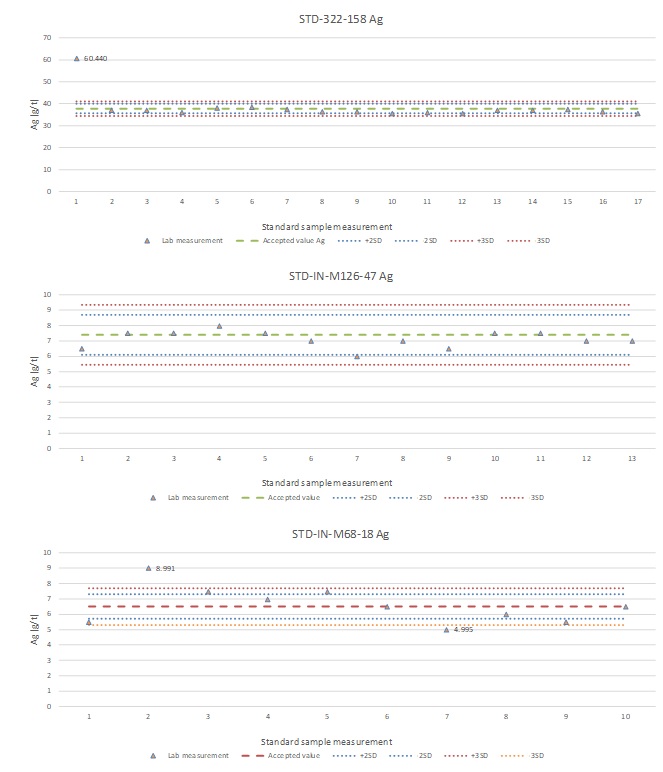
STD-322-158 and STD-IN-M126-47 Ag and STD-IN-M68-18 Ag
To view an enhanced version of this graphic, please visit:
https://images.newsfilecorp.com/files/690/302320_jroc8_enhanced.jpg
To view the source version of this press release, please visit https://www.newsfilecorp.com/release/302320
Source: Austral Gold Limited