
4.8 million ounces flowed into COMEX in eleven days. That is not the surprising part. The surprising part is what drove it, and what it does to the paper-to-physical math.
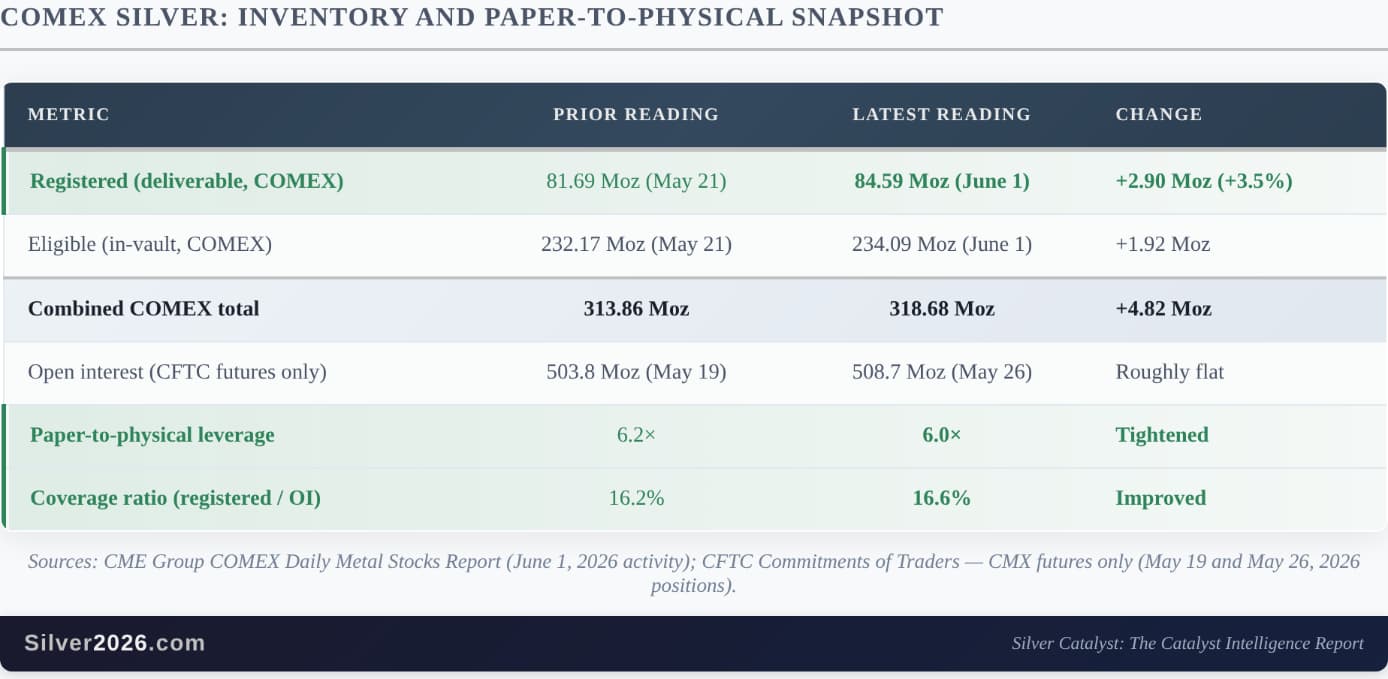
Six days after I published Issue #16 of the Silver Catalyst Newsletter, the June 1 COMEX inventory report showed combined silver stocks rising by approximately 4.8 million ounces since the May 21 reading cited in this issue. That brings total reported COMEX stocks to roughly 318.7 million ounces: 84.6 million sitting in the registered category as metal pledged for delivery against open futures contracts, and 234.1 million held to exchange storage standards but unpledged to any specific contract in the eligible category.
The price, meanwhile, did not cooperate. Silver was near $85 when Issue #15 was published on May 13. It fell to an intraday low of $74.11 on May 27. It briefly recovered to $76.67 on the June 2 close, then slid again to roughly $74.74 in early Wednesday trading on June 3, as gold dropped below $4,500 after a stronger-than-expected JOLTS print, with the CME FedWatch December rate-hike probability hovering near 40%, its highest level in months. Iran halted communications with Washington over the weekend after Israeli strikes in Lebanon, even as President Trump suggested a memorandum of understanding to reopen the Strait of Hormuz could be reached as soon as next week. The price is doing one thing. The physical market is doing another.
What just happened in the COMEX vault
Start with the data. COMEX is the largest paper-silver futures venue in the world: contracts trade against physical metal held across the CME-approved depository network, with the JP Morgan Chase vault holding by far the largest single share (about 140 Moz, or 44% of the total). Every business day, the exchange publishes a report showing how many ounces sit in each depository and in which classification. The June 2 report, covering June 1 activity, recorded the figures below alongside the prior reading from the May 21 data cited in this issue.
A few observations about this report.
The growth is mostly physical, not statistical. When the coverage ratio first broke above the 15% stress threshold during the May 13 to May 26 window, the improvement came primarily from open interest collapsing rather than from physical metal arriving. Speculative longs cut paper exposure as the price sold off, which mechanically shrank the denominator. This time the denominator (paper open interest) has been essentially flat, and the numerator (registered metal) has grown by nearly 3 million ounces. Real silver is being designated as deliverable.
The likely driver is the JUN 2026 contract delivery cycle. JUN first notice day fell on Friday, May 29, marking the start of a settlement window that runs through the end of June. As of the May 27 print, approximately 14.1 million ounces of contracts (around 2,820 contracts) had stood for delivery into JUN against 81.7 million ounces of registered stock. The daily reports show that the bulk of the registered growth between May 21 and June 1 actually occurred in the trading days leading up to FND (registered closed at roughly 85.0 Moz on May 29, before settling back to 84.6 Moz on June 1), consistent with depositories repositioning eligible metal into the registered category to satisfy expected delivery demand. The combined inventory continued to grow throughout the window as fresh metal entered the system across multiple depositories.
The other side of the trade matters too. The most recent CFTC Commitments of Traders report (covering positions as of May 26) shows non-commercial accounts running a net long of approximately 22,200 contracts (111 million ounces), down from 24,700 contracts (123 million ounces) the prior week. Speculative positioning continued to deleverage even after the formal stress reading eased. Paper kept getting lighter while physical metal kept showing up.
Why the reason matters
Two headline metrics tell you the COMEX system is less tight today than it was on May 21: paper-to-physical leverage has dropped from 6.2× to 6.0×, and the coverage ratio has improved from 16.2% to 16.6%. What sits underneath those numbers tells you whether the improvement is likely to last. The question is whether it came from registered metal arriving, or from open interest collapsing.
When stress eases because speculators close paper longs, the underlying physical scarcity remains intact, temporarily hidden by a shrunken denominator. The moment speculative positioning rebuilds (which it tends to do once it has compressed this far), the coverage ratio narrows again and the leverage ratio expands. That was the story between May 13 and May 26.
When stress eases because physical metal arrives via deliveries, the improvement is real in a more durable sense. Someone holding a paper contract decided to take the metal rather than roll the contract or close the position. The silver moved from “claim” to “ounce in a numbered bar in a vault.” That is a more durable form of improvement than the prior week’s paper-side compression, and the growth between May 21 and June 1 looks much closer to this category than the prior window did.
Even with the improvement, the headline paper-to-physical ratio is still around 6 ounces of paper for every ounce of registered physical. That is well below the 7.5× reading at peak positioning earlier in the cycle, and a fraction of the 28×-plus ratio that shows up once you widen the lens to include total futures, options, and unallocated London claims against all reported physical inventory (Catalyst #48 in the framework I analyze). But 6× is still elevated by historical standards. The system being less stretched is not the same as the system not being stretched.
And the deliveries themselves did not materialize out of thin air. Every ounce that flowed into the registered category between May 21 and June 1 came from somewhere, most likely from the eligible category at the same depository (an internal reclassification) or from external lease and borrowing channels. The total combined inventory growth of 4.8 million ounces, against a 2026 market deficit forecast at 46.3 million ounces by Metals Focus and the Silver Institute in the World Silver Survey 2026, is a tactical breather rather than a strategic resolution.
The structural picture beneath all of this remains what it was when I wrote about India pulling the world’s largest physical-silver bid last week. Silver supply is constrained at multiple points. Demand is being throttled at India, the largest investment-channel buyer in the world, even as coin and bar buying elsewhere is forecast strong in the World Silver Survey 2026, with industrial fabrication softening modestly. The price has dropped on rate expectations and positioning, not on anything in the physical balance. And the JUN delivery cycle is doing its slow, quiet work of moving paper claims into physical custody.
What this means
The near-term price path is not going to be set by a 4.8-million-ounce inventory print. It is going to be set by what happens with the US-Iran framework next week, the May nonfarm payrolls report on Friday, June 5, and whether the December rate-hike probability keeps climbing or backs off. The macro is doing what the macro is doing.
But the COMEX numbers matter for a different question, which is what the system looks like when those near-term forces resolve. The June 1 reading shows registered stocks accreting and the physical-paper spread tightening from the physical side, not just from positioning. That is a useful data point in my longer-term silver outlook, and it is the kind of slow structural improvement that does not show up in the chart on any given day but compounds over months.
Six ounces of paper for every ounce of registered physical is still six ounces of paper. The system has more slack than it had two weeks ago, and that slack will continue to widen if JUL deliveries follow the JUN pattern. The numbers also tell you the system has nowhere near the slack that conventional commodity markets carry, and that the gap between what paper traders are doing and what physical traders are doing is starting to narrow from the physical side rather than from the paper side.
Historically, gaps like that have closed with the physical side leading.
The COMEX dimension is one of eight in this issue’s premium Silver Rising framework, alongside the seven other Deep Dives.