

Related News Sell Alert on Altcoin That Surged 370 Percent: Massive Inflows of Tokens to Binance
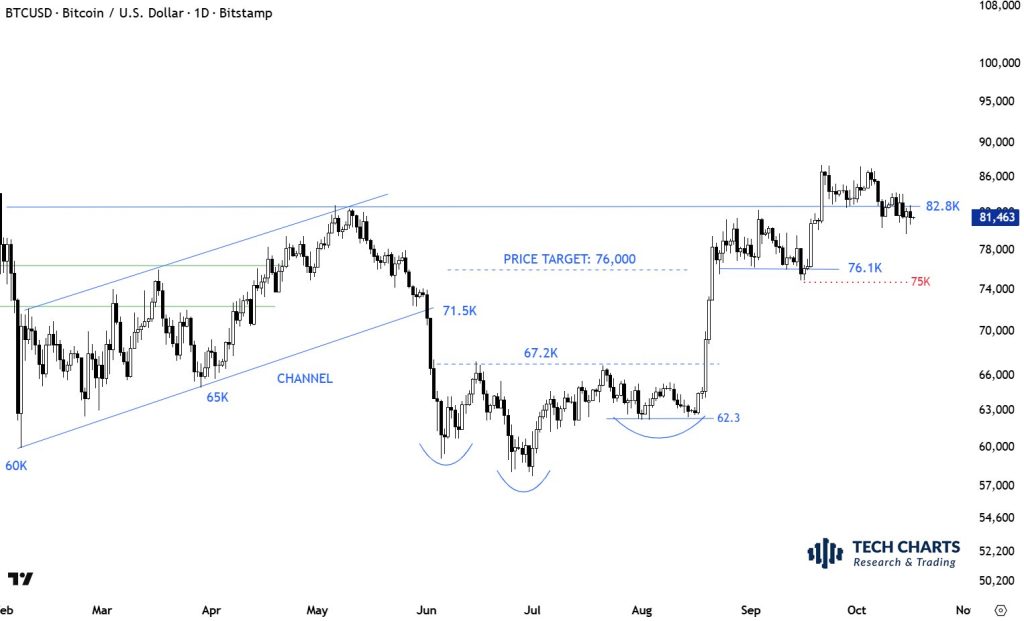
The analyst also drew attention to risk management regarding the technical signal at the $82,800 level. According to Kibar, the last low point formed within the wide rectangular pattern can be considered a broader stop-loss level for this signal.
Kibar also touched upon the technical structure of the inverse head and shoulders formation, stating that the lowest point of the right shoulder is particularly important. According to the analyst, this level can be used to determine whether the formation remains valid after an upward breakout from the neckline.
Kibar stated that if the price falls below the aforementioned low, the bullish formation could become invalid, and this could also generate a sell signal.
*This is not investment advice.