
Ru/TiO2 catalyst characterization
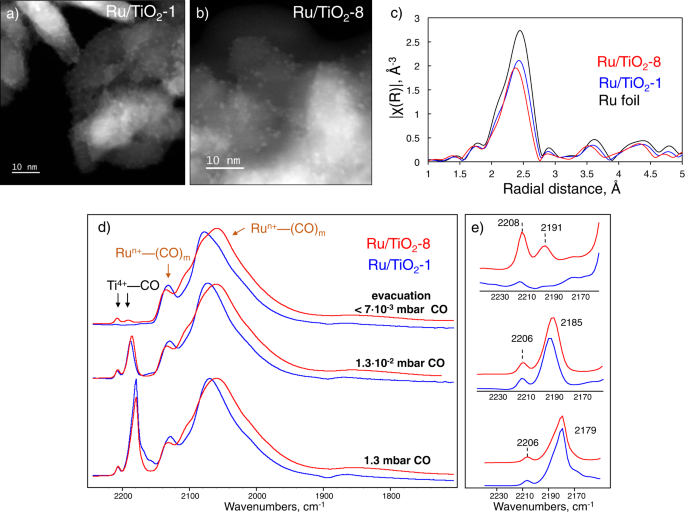
We changed the pH in the Ru deposition step, using aqueous NH3, to modify the catalyst (catalysts are labeled as Ru/TiO2-x, where x indicates the synthesis pH) while ensuring similar Ru loadings (~3 wt%), surface areas (100 m2/g) (Table 1), and pore volume. According to XPS quantitative analysis, all samples have similar surface Ru/Ti atomic ratios consistent with the same Ru loadings. XRD patterns (Supplementary Fig. 1) show relatively broad reflections of the TiO2 anatase support with no sign of crystalline Ru. Ex situ UV-Vis spectra reveal comparable bandgap energies, typical of pure anatase TiO2 (Table 1). All samples contain predominantly 1.4–1.6 nm Ru nanoparticles evenly distributed on TiO2 (STEM images in Fig. 1a, b and particle size distribution in Supplementary Fig. 2). TiO2 consists of elongated cylindrical, highly crystalline particles of 35–40 nm length and ~10 nm diameter. In situ Ru K-edge XANES spectra (Supplementary Fig. 3) after pre-reduction with H2 at 250 °C indicate metallic Ru0 and EXAFS spectral analysis (Table 1, Fig. 1c, Supplementary Fig. 3, Supplementary Table 1) show a coordination number of ~8.5, consistent with the STEM images.

a, b STEM images of Ru/TiO2-1 and Ru/TiO2-8, respectively; c EXAFS spectra of two samples and Ru foil standard; d FTIR of adsorbed CO at −296 °C at different CO pressures; e Zoom in of the 2240–2150 cm−1 region.
TGA results (Supplementary Fig. 4) show that ~10 mmol//\({{{{{{\rm{g}}}}}}}_{{{{{{{\rm{TiO}}}}}}}_{2}}\) of NH3 is retained after impregnation, an order of magnitude higher than Ti4+ on the surface18. NH3 desorbs in H2/He at ~250 °C, indicating strong interaction with the catalyst. NH3 can reduce and modify the TiO2 surface after high-temperature treatment19,20. Based on DRIFTS spectra (Supplementary Fig. 5) of Ru/TiO2-8 directly after impregnation and drying and before the reduction in H2, ammonia is adsorbed in several modes. Two possible mechanisms are proposed to explain the NH3 role during sample pre-reduction (Supplementary Figs. 6–8). XPS analysis shows no signs of N-doping of TiO2 after reduction.
To investigate the modification of the Lewis acidity, we used FTIR of adsorbed CO at −196 °С (Fig. 1d, e). At high CO pressure, Lewis acid site bands appear at 2206 and 2179 cm−1 due to highly electrophilic four-coordinated Ti4+(O4) sites on the particle edges and the less acidic five-coordinated Ti4+(O5) sites on the 101 crystal planes, respectively21. The concentration of Ti4+(O4) sites is similar in both samples. The intensity of both bands decreases with evacuation time, but the 2206 cm−1 band is reduced more slowly. Ru/TiO2-8 retains some CO on both sites even after prolonged evacuation, whereas Ru/TiO2-1 only marginally on the stronger Ti4+(O4) sites (Fig. 1e), indicating stronger binding and Lewis acidity on the former (Supplementary Fig. 9). DRIFTS demonstrates a smaller density of surface Ti-OH groups on the Ru/TiO2-8 and Ru/TiO2-12 than on Ru/TiO2-1 (Supplementary Fig. 10). Partial dehydroxylation enhances the Lewis acidity of Ti4+ sites due to the redistribution of the electron density on the surface22.
In addition to Ti4+–CO adducts, FTIR spectra show that Ru particles get partially oxidized by CO forming multiple Run+(CO)m (m = 1–4) carbonyls with ν(CO) vibration at 2136, 2106, 2084, and 2055 cm−1 (Supplementary Fig. 11)23. Due to the low-temperature CO dissociation, clusters of Run+ and Ru0 species form. The stronger interaction of TiO2 and Ru and the TiOx peripheral layer shifts the broad ν(CO) band to lower wavenumbers24 (from 2077 to 2059 cm−1, Fig. 1d), epitomizing a proximal MSI in the Ru/TiO2-8 catalyst.
Hydrogen binding on Ru/TiO2
H2 temperature-programmed desorption (TPD) (Supplementary Fig. 12) indicates a similar amount of strongly chemisorbed hydrogen on the Ru (low-temperature peak at 160 °C)25 and TiO2 (high-temperature shoulder at 250–300 °C)26. Temperature-programmed reduction (TPR) in H2 flow shows a spike in hydrogen adsorption at 80–90 °C, due to binding on Ru, and a broad peak starting at ca. 250 °C, due to partial TiO2 reduction (Supplementary Fig. 13). Interestingly, Ru/TiO2-8 and Ru/TiO2-12 show more pronounced hydrogen uptakes at 150-200 °C than Ru/TiO2-1. Hydrogen pulse chemisorption at 35 °C (Table 1) shows that Ru/TiO2 samples have different hydrogen uptakes. During an experiment, hydrogen can spillover to the TiO2 support obscuring the real Ru dispersion values. Thus the total H2 uptake inferred from pulse chemisorption depends on the spillover capacity of TiO2, rendering accurate quantification of the exposed Ru surface area impossible with the available methods. Also, the pretreatment temperature before pulse chemisorption (300 °C) is insufficient to remove all chemisorbed hydrogen from the sample. Thus, apparent uptakes may be higher for catalysts with weaker chemisorption.
To decouple Ru from support contributions to the hydrogen binding and activation, we used 2H MAS NMR of chemisorbed D2 (Fig. 2). Chemisorption of 2H on Ru clusters is accompanied by quadrupole interactions with the surrounding electric field gradient (EFG), leading to characteristic sidebands in the NMR spectra. Spectra contours depend on the quadrupole coupling constant (Qcc), a function of the largest EFG component (Vzz), and the asymmetry parameter η, defined as (Vxx − Vyy)/Vzz. One can obtain the EFG parameters, sensitive to the deuteron local surroundings and the binding type27,28.

a Solid-state 2H MAS NMR spectra of Ru/TiO2-8 measured at 4 kHz of spinning. b Fitting of experimental spectra. c Zoom in low-frequencies alongside three components used for fitting, resolved via deconvolution. d–f Deconvoluted signals of weakly bonded D on Ru (d), strongly bonded D on Ru in atop configuration, e, and Ti-OD and Ti←O+D2 groups on TiO2 (f). g DFT-deduced structure of atop bonded D on a Ru cluster. h, i Spectra at 10 kHz MAS for Ru/TiO2−1 (h) and Ru/TiO2−8 (i).
Figure 2a shows a complex line shape after sample reduction followed by saturation with 1 torr of D2. Deconvolution yields several components (Fig. 2b, c; high-resolution data at 10 kHz shown in Supplementary Fig. 14). The first component (Qcc~123–130 kHz/η~0.7–1.0) corresponds to Ti-OD formed by deuterium spillover, confirmed by measuring a D2O-treated pure TiO2 sample (Fig. 2f, Supplementary Fig. 15, Supplementary Table 2). Also, a simple H/D isotope exchange leads to the formation of Ti-OD groups29, and their presence in the spectra is not a fingerprint of spillover.
The latter peak has a symmetric EFG (η~0.1) and low Qcc of ca. 70 kHz, distinctly different from the Ti-OD signal (Fig. 2e, Supplementary Table 3), and consistent with Run-D hydrides27. The second component corresponds to deuterons bonded to Ru in atop conformation (see parameters in Supplementary Tables 3 and 4), confirmed using DFT calculations (Supplementary Fig. 16). Figure 2g shows an optimized structure of a Ru cluster on TiO2 with a D atom, in good agreement with a previous report30, underscoring the preferential formation of atop H instead of (Ru)2-H bridging binding. The EFG parameters depend on the Ru particle size and the support. For an unsupported Ru12 cluster, EFG is more symmetric, unlike the experimental data. Smaller or larger clusters than Ru12 on TiO2 provide a less adequate EFG. Thus, 2H NMR, combined with DFT, provides insights into MSI and particle size effects.
The third component gives a very broad single line with no sidebands (Fig. 2d) at a low resonance frequency (−4 to −4.4 kHz, or −53 to −57.3 ppm). These features are not standard for Run-D hydrides, observed previously for free-standing Ru clusters27. The negative chemical shift is similar to chemisorbed hydrogen on Ru particles on SiO2 and TiO2, inferred from static 1H NMR31,32. The deuteron interaction with the Ru conduction electrons leads to the so-called Knight shift responsible for the −53 ppm peak33. On Ru/SiO2, this peak stems from the overlap of different signals due to strongly and weakly chemisorbed hydrogen31. We exclude deuteron binding to an oxygen vacancy in TiO2 because it would lead to resonances close to 0 kHz at −1.07 ppm34 or −0.66 ppm and −0.78 ppm35. Static 1H NMR studies showed that the exact position and linewidth are highly affected by Na doping of a Ru/TiO2 catalyst36, i.e., this deuteron is sensitive to interactions with the support. In our case, direct interaction via Fermi contact between Ti3+ paramagnetic sites on the partially reduced TiOx support can affect the position and intensity of this peak.
Sample evacuation at 100 °C leads to a significant reduction in the intensity of the −53.2 ppm peak and shifting to −45.8 ppm (lower Knight shift) (Supplementary Figs. 17, 18, Supplementary Table 5). Interestingly, the ratio of Ti-OD and Ru-Datop groups remains constant, indicating comparable stability. Thus, the resonance at −53.2 ppm corresponds to the weakly bonded deuteron, not entirely captured in the TPD. Unlike the Ru-Datop signal, these deuterons are trapped by the Ru’s conduction electrons or some Ti3+ charged center of the support. Based on the thermal stability of the adsorbed deuterium studied by 2H MAS NMR and TPD, all three types of surface deuterons are stable at 25 °C and desorb only upon heating.
The 2H MAS NMR spectra reveal significant differences in the deuterons (Fig. 2h,i, Supplementary Fig. 19). The NH3-treated samples have a much higher content of Ru-bonded deuterium than Ti-OD groups. Higher resolution 10 kHz MAS spectra (Fig. 2h, i) show that Ru-related peaks at 0.18 kHz (2.1 ppm) and ~−4.49 kHz (−58.0 ppm) over Ru/TiO2-8 are more pronounced than on Ru/TiO2-1 The data combined (Supplementary Table 6, 7) reveals that Ru/TiO2-8 has a higher absolute amount of Ru-bonded deuterium. This was further supported by a direct comparison of relative distributions of different deuterons. Thus, NH3-treated supports promote hydrogen binding to Ru clusters.
Dynamics of hydrogen-Ru/TiO2 interactions
Hydrogen can partially reduce the TiO2 support by hydrogen spillover (Fig. 3)29, forming OH groups, and injecting electrons into TiO2, creating Ti3+ sites as a new state in the bandgap (Fig. 3a)37. Thermal excitation could also cause electron delocalization and populate the titania conduction band (CB)38. Specifically, hydrogen spillover creates a Ti3+ shallow trap, 0.1–0.2 eV below the CB edge, and a broadband in the FTIR spectra (Fig. 3c), frequently used to study spillover39,40. Electrons residing in the CB produce a power-law type spectrum distinct from shallow traps.

a Hydrogen spillover schematic over Ru/TiO2. b H2 binding on the metal-support interface. c Theoretical IR spectra for free electrons in the TiO2 conduction band and Ti3+ shallow trapped electrons. d, e Transmission FTIR transient spectra when switching from pure He to H2/He flow at 200 °C on Ru/TiO2−1 and Ru/TiO2−8, respectively. f Steady-state FTIR spectra for both samples at 250 °C and 0.14 bar H2. g, h In situ Raman spectra for Ru/TiO2-1 and Ru/TiO2-8 at 200 °C in He and H2/He flows, respectively (lines show Lorentzian curve fitting). i–k NAP-XPS of Ru/TiO2 samples under high vacuum and 1 mbar H2 pressure at 200 °C in T 2p (i), O 1 s (j), and Ru 3d (k) regions.
On Ru/TiO2-1, hydrogen binding leads primarily to shallow trap electrons (Fig. 3d). Due to the reversible spillover, this partial reduction is sensitive to temperature and hydrogen pressure (Supplementary Figs. 20, 21). A much broader background increase is seen on Ru/TiO2-8 due to the additional partial CB filling (Fig. 3e, Supplementary Fig. 22). The Ti-OH groups give a slight negative peak of ν(OH) at 3665 cm−1, and a new peak for δ(HOH) at 1614 cm−1 emerges due to the recombinative dehydroxylation of vicinal Ti-OH groups into water. Water formation stimulates the population of CB electrons41. FTIR shows that Ru/TiO2-1 is mainly reduced into localized Ti3+ states, whereas NH3-treated samples produce delocalized CB electrons (Fig. 3f). Hydrogen spillover is activated only at sufficiently high H coverage on Ru particles30, i.e., the low H coverage on the Ru/TiO2-1 sample (detected by 2H NMR) does not promote spillover and TiO2 reduction to the same extent.
In situ Raman spectroscopy at 200 °C in He and H2/He flows (Fig. 3g, h) corroborates this result. The Eg(1) vibrational mode of TiO2 anatase (~144 cm−1) is sensitive to the concentration of electrons42. On Ru/TiO2-1, the peak position is unaffected by hydrogen (Fig. 3g). In contrast, on Ru/TiO2-8 it shifts by ~3 cm−1 due to forming CB electrons by hydrogen; shallow traps (Ti3+ states) do not contribute.
The extent of reduction and associated charge transfer were monitored using NAP-XPS. Upon introducing hydrogen at 200 °C to Ru/TiO2-8, the Ti 2p3/2 peak (458.69 eV; Fig. 3i, Supplementary Fig. 23, Supplementary Table 8) and the main lattice oxygen peak in the O 1 s region43 (Fig. 3j) shift to lower binding energies by 0.15 eV due to modest support reduction. No shifts are evident on Ru/TiO2-1, indicating low receptivity toward hydrogen. Since the penetration depth of NAP-XPS corresponds to 2–3 nm, the Ru 3d and Ti 2p signals are collected from the whole Ru nanoparticle volume and 1–2 atomic layers of the underlying TiO2 support44. Thus, changes in the XPS spectra reflect charge distribution and MSI, but are not sensitive to the formation of the narrow TiOx peripheral layer observed in the FTIR of CO experiments (Fig. 1d).
The Ru 3d doublet overlaps with the C 1 s signal caused by carbonaceous deposits on the initial TiO2 (Fig. 3k). Ru/TiO2-1 and Ru/TiO2-8 have slightly different binding energy (BE): 279.70 and 280.12 eV, respectively (Supplementary Table 8). Such values are typical for small Ru particles on TiO244. Upon exposure of Ru/TiO2-1 to hydrogen at 200 °C, the BE of the Ru 3d5/2 peak increases by 0.12 eV; over Ru/TiO2-8, it shifts by 0.61 eV, indicative of Ruδ+ species. H2 activation at the Ru-TiO2 interface leads to negatively charged H− attached to the metal and H+ binding to the nearest oxygen atom (Fig. 3b)45. This heterolytic hydrogen activation leads to a partial positive charge on Ru due to forming negatively charged hydrides (H−) (Fig. 3b). The direct charge transfer from Ru to TiO2 CB leads to a partial reduction of TiO2, as reported in CO2 reduction46. Ruδ+-H− pairs upon H2 adsorption were also reported on Ru/carbon nanotubes47. Ru on NH3-treated supports allows spillover of H2, forming delocalized electrons, reducing the support more extensively, and increasing the positive charge of Ru.
PP hydrogenolysis
PP hydrogenolysis data over the three Ru/TiO2 samples with two polymer/catalyst weight ratios, 20 and 40, is shown in Fig. 4a–c and Supplementary Figs. 22, 23. The liquid yield increases with time and reaches 74% (Ru/TiO2-8) and 65–70% (Ru/TiO2-12) at 6 h, compared to only 63% at much longer times of 20 h (Ru/TiO2-1) reported earlier6. The conversion of the solid residue follows the same trend. The liquid product’s weight-average molecular weight (Mw) (Fig. 4c, Supplementary Tables 9, 10) is lower over Ru/TiO2-8 and Ru/TiO2-12 than Ru/TiO2-1.

a, b Yields of liquids (a) and solid residue (b) vs. time. c Mw of liquid vs. time. d, e Effect of substitution of H2 with D2 on liquid molecular weight distribution over Ru/TiO2-1 (d) and Ru/TiO2-8 (e) catalysts. f Effect of hydrogen pressure on liquid yield over Ru/TiO2-1 (the dotted line extrapolates the data, using a simple A → B → C kinetic scheme). Conditions: 250 °C, 30 bar H2, 2 g PP, 0.05 g catalyst (a, c) or 0.1 g catalyst (b, d–f) for a PP/catalyst ratio of 40 and 20, respectively.
PP conversion follows6 (i) an initial polymer consumption forming a “heavy” liquid; (ii) a decrease of the liquid Mw; and (iii) consumption of the liquid to light gases (~85% methane). When the Mw reaches a critical value, cascade hydrogenolysis to gas starts. Ru/TiO2-8 and Ru/TiO2-12 substantially increase the solid consumption and the liquid C–C bond hydrogenolysis compared to Ru/TiO2-1, leading to lighter products (Fig. 4c, Supplementary Tables 9, 10).
All catalysts show similar methane formation up to ca. 10% at long reaction times due to excessive liquid hydrogenolysis (Supplementary Figs. 24, 25, Supplementary Table 11). To study liquid gasification in more detail, we performed experiments at a higher polymer to catalyst ratio of 20 (Fig. 4b). The liquid stability increases in the order: Ru/TiO2-12 < Ru/TiO2-8 < Ru/TiO2-1 in line with the liquid Mw.
In the PE conversion over Ru/ZrO2 and Ru/WOx/ZrO2, the hydrogen availability on Ru was crucial in controlling the hydrogenolysis selectivity to liquids vs. light gases15. A high intrinsic H coverage favors liquid products. Conversely, a low H coverage promotes a sequential cascade of C–C rupture to methane.
We hypothesize that the performance differences among catalysts stem from the H coverage on Ru. We perform experiments of varying H2 pressure (Fig. 4f). An increased hydrogen pressure leads to higher reaction rates over Ru/TiO2-1; the liquid yield reaches ca. 60% in 6 h (40 bar H2) and 3 h (50 bar H2), much faster than the 30 bar experiment. Still, the liquid to gas decomposition is also accelerated (Supplementary Fig. 26, Supplementary Table 12). This competition leads to a maximum liquid yield. The liquid decomposition on the ammonia-treated Ru/TiO2 samples is less severe, and a maximum is absent at a polymer to catalyst ratio of 20 (Fig. 4a). This maximum is visible at higher catalyst loadings (Fig. 4b, Supplementary Fig. 25) and shifts to shorter reaction times. The increased H coverage at the same H2 pressure drives the improved catalyst performance, consistent with the 2H MAS NMR data of the higher content of both Ru-H species and spillover (Fig. 2). We propose that the different nature of chemisorbed hydrogen may be partially responsible for the variation in the liquid yields over different samples. Thus, a simple increase in surface coverage of hydrogen is insufficient to get a similarly high liquid yield over Ru/TiO2-1 and Ru/TiO2-8.
Alkane hydrogenolysis invokes (Fig. 5) adsorption to the metal, leading to dehydrogenated intermediates, C–C bond breaking of these intermediates, and final hydrogenation and product release. The first step is usually quasi-equilibrated48 due to the lower dehydrogenation barrier than the C–C bond breaking49. Experiments in D2 lead to slower dehydrogenation due to a kinetic isotope effect (KIE) in the dehydrogenation step, while the C–C bond breaking is not strongly affected by the H/D change50.
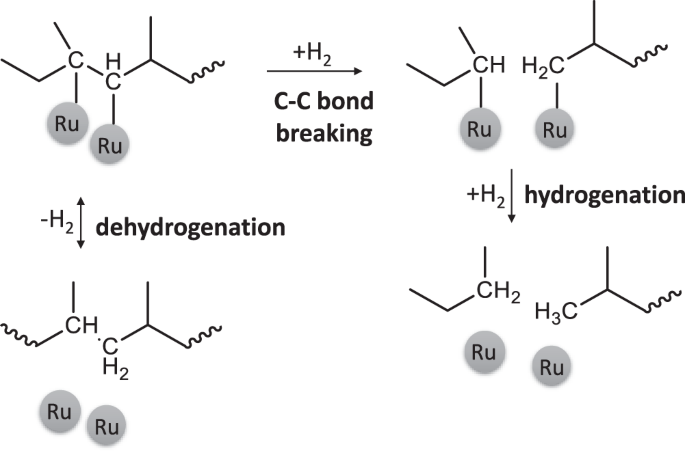
Dehydrogenation happends in both directions, while C–C bond breaking is considered irreversible.
PP hydrogenolysis in D2 is slower6, and the Mw of the liquid is larger, consistent with our data on Ru/TiO2-1 and Ru/TiO2-8 (Fig. 4d, e). A prominent shift in Mw is evident over Ru/TiO2-1 (from 2.67 to 14.12 kDa). Quasi-stationary kinetic analysis with standard transition state theory calculations, based on Fig. 5 (see Supplementary discussion I, Supplementary Fig. 27), shows that increasing the H coverage increases the net hydrogenolysis rate, reduces the KIE, and makes the net reaction rate less sensitive to the H/D exchange. Since Ru/TiO2-8 has a higher H coverage, the reaction rate is less sensitive to deuteration and correlates with the hydrogenolysis data (Fig. 4a). Over the Ru/TiO2-8, a high H coverage pushes further C–C bond breaking, leading to consumption of the initial polymer with no solid residue. On Ru/TiO2-1, the lower H coverage makes dehydrogenation more kinetically relevant and the initial polymer deconstruction slower.
In PE conversion on Ru/ZrO2, higher H coverages accelerate the desorption of reaction intermediates, preventing them from over-cracking, and giving higher liquid selectivity over methane at high H2 pressures. In PP, an increased H coverage boosts all three reaction stages because the PP initial polymer deconstruction is slower than the product desorption. Thus, altering the H coverage primarily alters this reaction step.