Why the Platinum Group Metals Supply Deficit Is No Longer a Simple Commodity Story
Commodity markets typically self-correct. When prices rise, producers invest, supply expands, and the imbalance closes. That mechanism has functioned reliably across energy, base metals, and agricultural markets for decades. The platinum group metals supply deficit now unfolding in 2026 does not follow that script. Mine output has fallen for five consecutive years against a backdrop of rising prices, above-ground inventories have eroded to critically thin levels, and the two jurisdictions that collectively dominate global supply, South Africa and Russia, are both experiencing structural constraints that higher spot prices alone cannot resolve.
Understanding why this market has decoupled from standard commodity theory requires examining the geology, the geopolitics, the trade enforcement mechanisms, and the entirely new demand curve emerging from hydrogen infrastructure. Furthermore, PGM supply constraints are not temporary dislocations. They represent a fundamental repricing of platinum and palladium as strategic scarcity assets.
When big ASX news breaks, our subscribers know first
The Anatomy of a Supply Deficit That Higher Prices Cannot Fix
How Deep Is the Shortfall, and Why Is It Persisting?
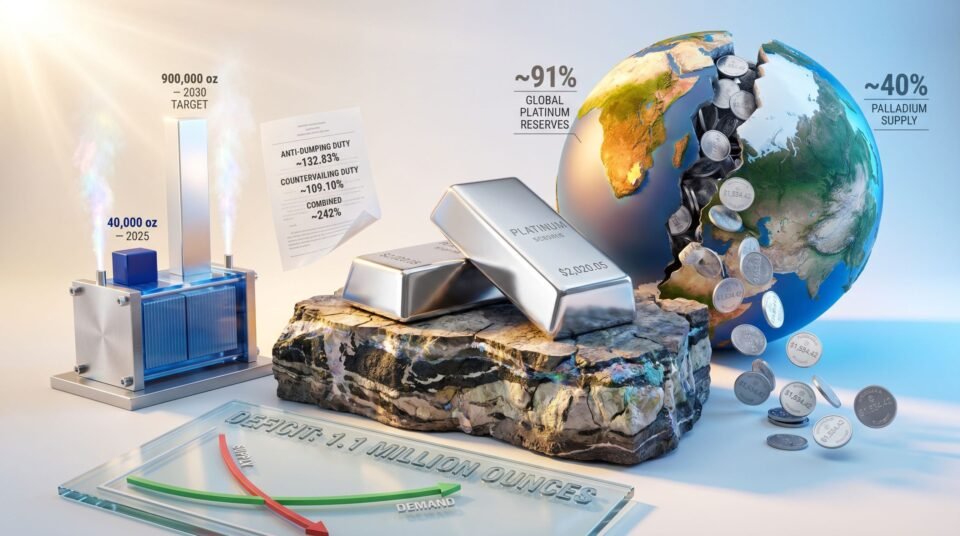
The World Platinum Investment Council confirmed a 1.1 million ounce platinum deficit in 2025, with a projected 240,000 ounce deficit continuing into 2026. Total global platinum mine supply in 2025 fell 5% year-on-year to approximately 5.51 million ounces, running roughly 10% below the pre-COVID five-year average. Primary platinum production peaked at just over 6 million ounces in 2021 and has declined in each subsequent year, even as the spot price approximately doubled over the same period.
| Year | Estimated Platinum Deficit (thousand ounces) |
|---|---|
| 2023 | ~896 koz |
| 2024 | ~992 koz |
| 2025 | ~1,100 koz |
| 2026 (projected) | ~240 koz |
| 2026-2029 (annual average) | ~348-689 koz |
Source: World Platinum Investment Council; industry consensus projections
The consequence of sustained deficits is inventory depletion. Above-ground platinum stocks have now declined to approximately four months of demand coverage, a threshold widely regarded as the boundary between manageable market tightness and price-volatile scarcity. Below this level, the market loses its primary buffer against operational disruptions, and even modest supply interruptions can generate outsized price responses.
The Capital and Infrastructure Lock Preventing a Supply Response
The 2026 World Platinum Investment Council base case projects flat mine supply year-on-year, with the only marginal increase, approximately 2%, attributable to a 10% rise in recycling activity rather than new primary production. This is not a market where producers are holding back investment opportunistically. The constraints are structural:
- Deep-level underground mining in South Africa’s Bushveld Igneous Complex requires multi-year capital commitments and development timelines before new ounces reach the market
- South Africa holds approximately 91% of global platinum reserves, meaning the global supply response is heavily dependent on a single jurisdiction’s capacity to invest and operate reliably
- National grid reliability constraints in South Africa have increased operational downtime across multiple major producers
- Electricity costs for South African PGM miners increased approximately 60% between 2021 and 2026, directly compressing the reinvestment economics that would ordinarily support expansion
- Labor disruptions at major South African operations, including Impala Platinum’s Rustenburg complex in early 2026, have removed additional ounces from the market at a time when inventory buffers are already depleted
The South African primary output contraction from approximately 5.3 million ounces in 2006 to an estimated 3.9 million ounces in 2025 illustrates the long-term trend underlying the current deficit. This is not a temporary disruption but a structural decline in the world’s dominant producing jurisdiction.
South Africa’s diesel exposure compounds the energy cost problem. Approximately 60% of the country’s diesel imports transit the Strait of Hormuz, meaning that any escalation in Middle East geopolitical tensions translates directly into higher haulage and processing costs for deep-level mines. Consequently, these twin energy pressures, grid unreliability and diesel import exposure, create a cost environment that deters the capital commitment necessary to reverse the production decline. The broader metals geopolitics at play here further complicate any straightforward supply recovery.
Russian Palladium Tariffs and the Restructuring of Western Procurement Markets
The Trade Enforcement Action That Is Reshaping Palladium Supply Chains
Russia accounts for approximately 40% of global palladium supply, concentrated within Norilsk Nickel’s Arctic operations. That geographic concentration has been a recognised systemic risk for Western industrial buyers for years. The translation from risk awareness to regulatory action accelerated sharply in 2025 and 2026, driven by a volume-price divergence in Russian export data that formed the core of a formal dumping allegation.
Russian palladium exports to the United States rose 35% in volume to approximately 27.6 tonnes in 2024, even as palladium spot prices fell approximately 50% over the same period. Under standard market economics, falling prices should reduce export volumes. The observed inverse relationship, rising volumes as prices declined, is consistent with below-cost or state-subsidised export behaviour, the legal foundation for an anti-dumping determination. Industry analysts tracking platinum and palladium dynamics have noted this divergence as particularly significant.
The regulatory timeline unfolded as follows:
- July 2025 – Sibanye-Stillwater and the United Steelworkers Union filed a formal petition with the US Department of Commerce alleging dumping and subsidisation of Russian palladium exports
- 2025 – The Stop Russian Market Manipulation Act advanced in the US legislative environment, signalling bipartisan support for trade remedy action
- February 2026 – The US Department of Commerce issued a preliminary affirmative determination, calculating a combined anti-dumping and countervailing duty margin of approximately 242%, with a separate preliminary anti-dumping margin of approximately 828% on unworked Russian palladium imports
- April 28, 2026 – Final anti-dumping determination deadline
- May 19, 2026 – International Trade Commission injury ruling scheduled
What an 828% Anti-Dumping Margin Means in Practice
A preliminary anti-dumping margin of this scale does not simply raise the cost of Russian material. At 828%, it effectively prices Russian palladium out of the US market for virtually all commercial applications. North American automotive manufacturers, electronics producers, and chemical processors that previously sourced Russian palladium must now access South African, Zimbabwean, or recycled streams, paying a structural premium for non-Russian supply that is permanent for as long as the trade remedy remains in force.
The Stillwater mine in Montana, operated by Sibanye-Stillwater and representing North America’s only primary PGM producer, stands as the most direct domestic beneficiary of a sustained trade remedy. A permanent tariff regime could support approximately 700 jobs at the facility and restore a meaningful Western supply chain anchor.
The tariff mechanism also introduces a jurisdictional premium into palladium pricing. Western original equipment manufacturers now face an implicit cost for Russian-origin material that non-Russian producers do not bear. According to analysis from Crux Investor, this procurement shift raises the strategic value of geographically diversified primary palladium supply in a way that market price signals alone never could.
How Federal Reserve Dissent Transmitted Into PGM Markets
The late-April 2026 Federal Open Market Committee meeting produced an unusual internal split: four dissenting votes signalling support for an earlier interest rate reduction than the committee consensus indicated. That dissent transmitted directly into precious metals markets through two well-understood channels.
Channel one, opportunity cost compression: Reduced Treasury yield expectations diminish the return differential between interest-bearing instruments and non-yielding metals. When the cost of holding platinum or palladium relative to Treasuries falls, institutional allocations to the metals increase.
Channel two, dollar softening: Rate cut expectations exert downward pressure on the US dollar, which historically moves inversely with commodity prices denominated in dollars. A weaker dollar makes platinum and palladium cheaper in non-dollar currencies, broadening the pool of buyers and supporting price floors.
The observed market response was immediate and significant:
- Platinum advanced 5.72% to $2,003.30 per ounce in a single session on April 30, 2026
- Palladium gained 5.24% to $1,556.70 per ounce in the same session
- On May 6, 2026, platinum added a further 3.4% to $2,020.05 per ounce and palladium rose 3.3% to $1,534.42 per ounce
Platinum reached approximately $2,878 per ounce in January 2026 before stabilising near $2,000 per ounce by late April. Palladium gained approximately 57% year-over-year to $1,469.50 per ounce by May 1, 2026. Bank of America Global Research raised its 2026 platinum price forecast to $2,450 per ounce from $1,825 per ounce at the start of the year, citing persistent market deficits and the structural dislocations from ongoing trade disputes. The 2025 platinum spot rally totalled approximately 127%, reflecting the speed at which institutional investors repositioned once the deficit thesis became verifiable in publicly available supply-and-demand data.
Hydrogen Infrastructure and the Second Demand Curve for Platinum
The Fuel Cell Chemistry That Makes Platinum Difficult to Replace
Platinum catalyses the oxygen reduction reaction in proton exchange membrane (PEM) fuel cells, the dominant technology in hydrogen vehicle and stationary power applications. Current platinum loading rates range from 0.1 to 0.2 grams per kilowatt of output, with industry research targeting below 0.05 grams per kilowatt by 2030. PEM technology remains the benchmark for large-scale hydrogen applications precisely because of platinum’s unmatched catalytic performance.
The case for substitution is weaker than headlines about alternative catalysts often suggest. In April 2026, researchers at Washington University in St. Louis demonstrated a rhenium-molybdenum phosphide catalyst sustaining 2.0 amperes per square centimetre for more than 1,000 hours in an anion-exchange membrane electrolyser, a technically meaningful milestone. However, durability scaling, cold-start performance qualification, and large-area manufacturing validation leave platinum commercially dominant in PEM fuel cells through at least 2035 according to industry forecasts. A laboratory milestone and a commercially deployable substitute are separated by a decade or more of engineering qualification.
Quantifying China’s Hydrogen Demand Trajectory
China’s hydrogen buildout is translating into measurable platinum consumption at a scale that is beginning to register in global demand forecasts. Furthermore, the broader critical minerals demand picture reinforces why this trajectory matters for long-term supply planning.
| Metric | Current (2025) | Target (2030) |
|---|---|---|
| Annual hydrogen-related platinum demand | ~40,000 oz | ~900,000 oz |
| China fuel cell electric vehicles operational | 40,000 | 100,000 (target) |
| China hydrogen refuelling stations | 574 | Expanding |
| Hydrogen cost target (China) | ~$4.80/kg | ~$3.50/kg |
| PEM platinum loading target | 0.1-0.2 g/kW | <0.05 g/kW |
Source: World Platinum Investment Council projections; Chinese government infrastructure targets
The projected growth from 40,000 ounces to 900,000 ounces of annual hydrogen-related platinum demand by 2030 represents a 22-fold increase and approximately 11% of total global platinum demand at the latter figure. Critically, this demand channel operates independently of the automotive catalytic converter cycle and grows alongside, rather than in competition with, battery electric vehicle adoption.
This demand divergence matters for the platinum-versus-palladium investment thesis. Palladium faces a forecasted transition toward surplus conditions by 2027-2028 as battery electric vehicle penetration reduces gasoline autocatalyst demand and recycled palladium volumes increase. Platinum’s deficit trajectory moves in the opposite direction, deepening rather than resolving as hydrogen infrastructure scales. Hybrid vehicles, which consume 10% to 20% more platinum group elements per vehicle than conventional internal combustion vehicles, provide an additional near-term demand bridge before fuel cell deployment reaches scale.
China’s Futures Market and the Globalization of PGM Price Discovery
What the Guangzhou Futures Exchange Launch Means for PGM Pricing
China’s Guangzhou Futures Exchange launched physically-backed platinum and palladium futures contracts in the second half of 2025, a development Bank of America Global Research cited as a contributing factor in its upward revision to the 2026 platinum price forecast. The significance of this development extends beyond the immediate price impact.
The new contracts introduce Chinese institutional and retail capital into PGM price formation, a process historically dominated by London and New York markets. China’s simultaneous positioning as the world’s largest hydrogen infrastructure investor and a growing PGM futures market participant creates a reinforcing dynamic: physical demand growth in China now has a financial market expression that feeds back into global pricing. This integration tightens the link between China’s hydrogen deployment targets and platinum spot prices in ways that Western-only market participants may systematically underestimate. Recent commentary from small-cap analysts has similarly highlighted this emerging dynamic as a structural shift in how PGM prices are discovered globally.
The next major ASX story will hit our subscribers first
Western Government Capital Deployment and the Critical Minerals Financing Shift
From Policy Statements to Direct Capital Allocation
The transition from declaratory policy to direct capital commitment represents a qualitative shift in how Western governments are treating PGM supply security. Two developments in February 2026 illustrate the scale of the change:
- The Export-Import Bank of the United States approved a $10 billion Direct Loan for Project Vault, designed to establish a domestic critical minerals reserve
- The Export-Import Bank has issued $14.8 billion in Letters of Interest for critical minerals projects under the current administration
- The US State Department hosted the 2026 Critical Minerals Ministerial, convening representatives from 54 countries and the European Commission to coordinate Western supply chain responses
These financing mechanisms mirror precedents already established in the US rare earth and uranium sectors, where government loan guarantees and equity participation preceded private capital re-engagement in development-stage projects. Investors familiar with those cycles recognise the pattern: government capital de-risks early development, lowers the cost of subsequent equity raises, and compresses the valuation discount that development-stage projects typically carry relative to producing assets.
Evaluating Development-Stage PGM Projects Outside the Dominant Supply Corridors
The Multi-Factor Investment Screening Framework
As Western procurement agencies and institutional investors screen PGM development projects, a clear evaluation framework has emerged around jurisdictional diversification, infrastructure access, resource scale, and metallurgical pathway viability.
Key criteria applied in project assessment:
- Jurisdictional stability and permitting track record relative to South Africa and Russia
- Infrastructure access, including grid power connectivity, port proximity, and road networks
- Resource scale, with minimum thresholds for economic development justification
- Metallurgical recovery rates and processing pathway capital intensity
- Near-surface mineralisation, which reduces development capital requirements relative to deep underground deposits
- Alignment with Western critical minerals financing programmes and off-take frameworks
Brazil and Western Australia have attracted the most attention as alternative development corridors. Both jurisdictions offer grid power, Atlantic or Indian Ocean port access, and permitting frameworks with precedent for foreign-owned large-scale mining development. Near-surface PGM mineralisation in these regions carries a capital intensity advantage over the deep-level underground deposits that characterise the Bushveld Igneous Complex, where multi-hundred-metre shaft development is required before any ore is recovered.
A Case Study in Alternative Jurisdiction PGM Development
ValOre Metals Corp. operates the Pedra Branca platinum group metals supply deficit-relevant project in Ceará State, Brazil, hosting a 2,198,000 ounce inferred two platinum group element plus gold resource across 63.3 million tonnes grading 1.08 grams per tonne, distributed across seven near-surface zones spanning 51,096 hectares per the company’s March 8, 2022 National Instrument 43-101 technical report. Bioleaching test work conducted with the University of Cape Town demonstrated platinum and palladium extractions of 73% and 74% respectively, supporting a heap-leach development pathway with potentially lower capital intensity than conventional flotation circuits.
The company carries a market capitalisation of approximately C$26 million against 2,198,000 inferred ounces, implying an enterprise value per inferred ounce of approximately C$12. A Preliminary Economic Assessment is targeted for publication in the fourth quarter of 2026, which would establish base-case capital and operating cost guidance and provide a quantified development pathway for the project. ValOre is a member of Discovery Group, whose member companies have collectively participated in more than C$2.6 billion in merger and acquisition transactions and raised more than $1 billion in equity since 2002, including the C$1.8 billion sale of Great Bear Resources in 2022.
Investor Note: This article discusses development-stage mining companies and PGM market forecasts that involve significant uncertainty. Resource estimates, price projections, production timelines, and demand forecasts are subject to material revision. Nothing in this article constitutes financial or investment advice. Investors should conduct independent due diligence and consult qualified financial advisers before making investment decisions.
What Is Driving the Persistent Platinum Group Metals Supply Deficit?
The platinum group metals supply deficit is structural rather than cyclical. Primary platinum mine output has declined from a peak of approximately 6 million ounces in 2021 to a projected 5.5 million ounces in 2026, while annual demand has remained broadly stable at approximately 8 million ounces. Recycling volumes are recovering slowly from a period of suppressed collection, and new primary supply requires multi-year development timelines that cannot respond to current price signals within the near-term window. Above-ground inventories at approximately four months of demand cover leave the market with minimal buffer against further operational disruption.
How Do Russian Palladium Tariffs Affect North American Industrial Buyers?
The combined preliminary tariff margin of approximately 242%, comprising anti-dumping and countervailing duties, and a separate preliminary anti-dumping calculation of approximately 828% on unworked Russian palladium imports, effectively prices Russian material out of the US market for most commercial applications. North American automotive manufacturers, electronics producers, and chemical processors previously sourcing Russian palladium must now access South African, Zimbabwean, or recycled streams, typically at a premium. The tariff structure also creates a regulatory incentive for domestic PGM production, with Sibanye-Stillwater’s Stillwater mine in Montana positioned as the primary near-term beneficiary.
Why Is Hydrogen Demand Strategically Important for Platinum Investors?
Hydrogen fuel cells require platinum as a catalyst, and no commercially viable substitute exists for platinum in proton exchange membrane configurations through at least 2035 according to industry forecasts. World Platinum Investment Council projections indicate hydrogen-related platinum demand could grow from approximately 40,000 ounces annually to approximately 900,000 ounces by 2030, a 22-fold increase representing approximately 11% of total global platinum demand. This demand channel is independent of the automotive cycle and grows alongside battery electric vehicle adoption rather than being displaced by it.
What Does Four Months of Demand Cover Mean for Market Risk?
Above-ground inventory coverage of approximately four months represents the approximate threshold below which the platinum group metals supply deficit becomes acutely price-sensitive. At this inventory level, events such as labour stoppages, grid failures, or logistics interruptions in South Africa translate more directly and rapidly into spot price volatility than they would in a market with six to twelve months of coverage. It is the inventory metric, rather than the annual supply-demand balance alone, that determines how quickly and severely price responses occur when operational disruptions materialise.
Want to Track the Next Major PGM Discovery Before the Broader Market Does?
Discovery Alert’s proprietary Discovery IQ model delivers real-time alerts on significant ASX mineral discoveries — including platinum group metals — instantly converting complex geological data into actionable investment insights for both short-term traders and long-term investors. Explore historic discoveries and their extraordinary returns, then begin your 14-day free trial to position yourself ahead of the market.