
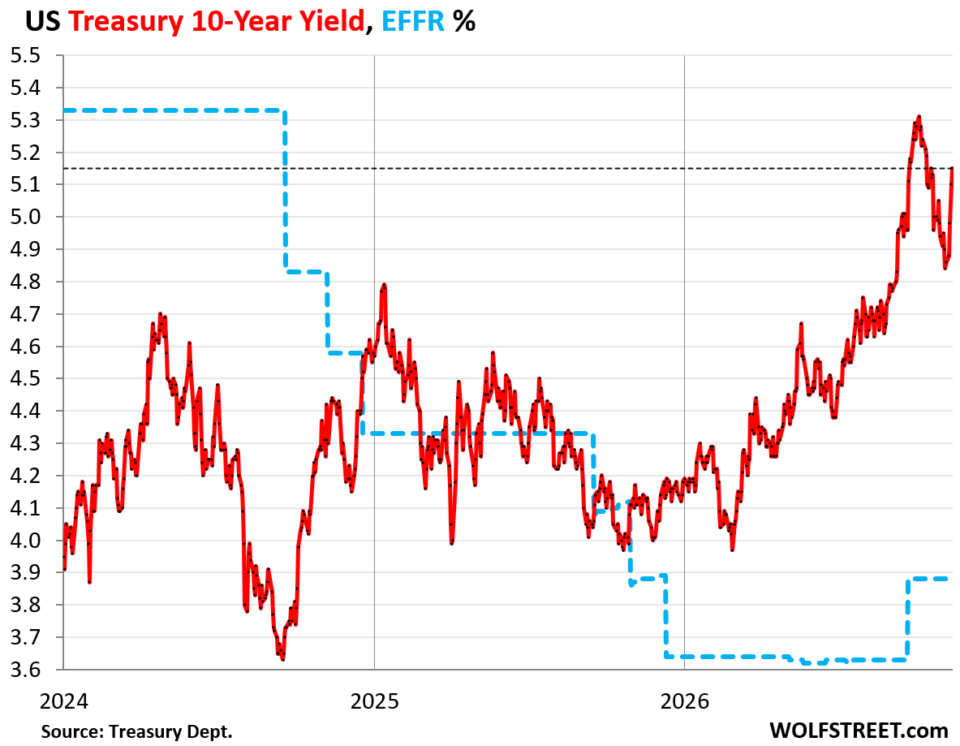
The government sold $766 billion of Treasury securities this week, in nine auctions on three days.
By Wolf Richter for WOLF STREET.
It was an ugly week for the bond market. The 10-year Treasury yield spiked by 29 basis points this four-day week, including by 10 basis points on Tuesday (on Wednesday, the bond market was mercifully closed for Veterans Day), by 12 basis points on Thursday, and by 5 basis points on Friday, to 5.15%. A spike in yields means bond prices fell sharply.
At the low point in the morning of Thursday, November 5, the 10-year yield had traded as low as 4.82%, before the bond selloff began. That’s a 33-basis-point surge in six trading days, a big move, undoing two-thirds of the rally from October 5 to November 5.
The yield is now within spitting distance of the 5.31% high on October 5. The dotted blue line represents the Effective Federal Funds Rate, which the Fed targets with its short-term policy rates.
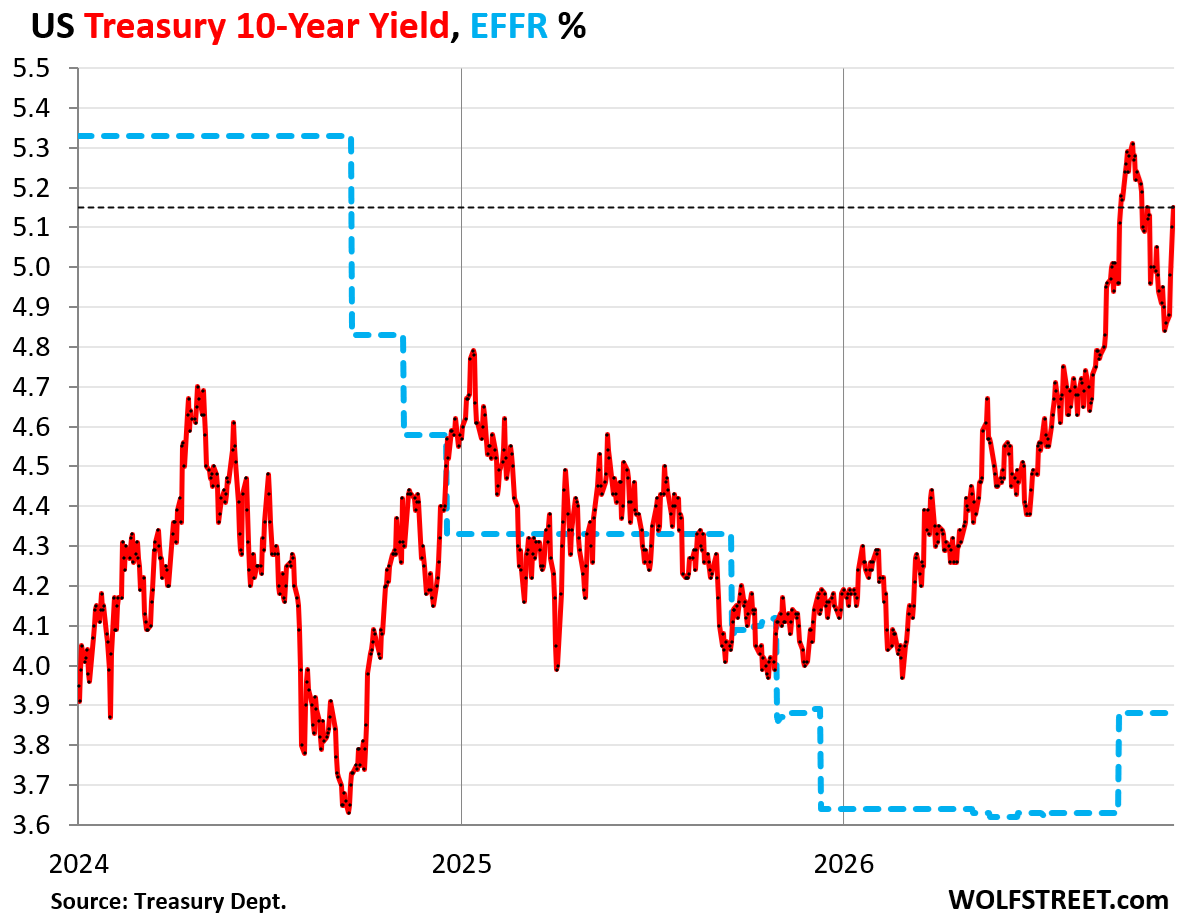
The bond selloff was driven serially by nasty CPI Inflation data and a rough 10-year Treasury auction on Tuesday – it took a yield of 5.02% to sell all $51 billion of notes, 14 basis points higher than the yield in the secondary market before the release of the CPI data. This was followed on Thursday by a rough 30-year Treasury auction (at 5.44%), and on Friday by ugly PPI data, showing that businesses faced 6.5% inflation, the worst since November 2022.
Hawkish speeches by Fed governors and Fed presidents peppered these moves, including by Governor Waller whose trigger for a 50-basis-point hike preference at the December FOMC meeting was hit smack-dab in the middle by the month-to-month increase of core CPI (+0.30%). Resurging inflation is the scourge of the bond market. And this week was full of it.
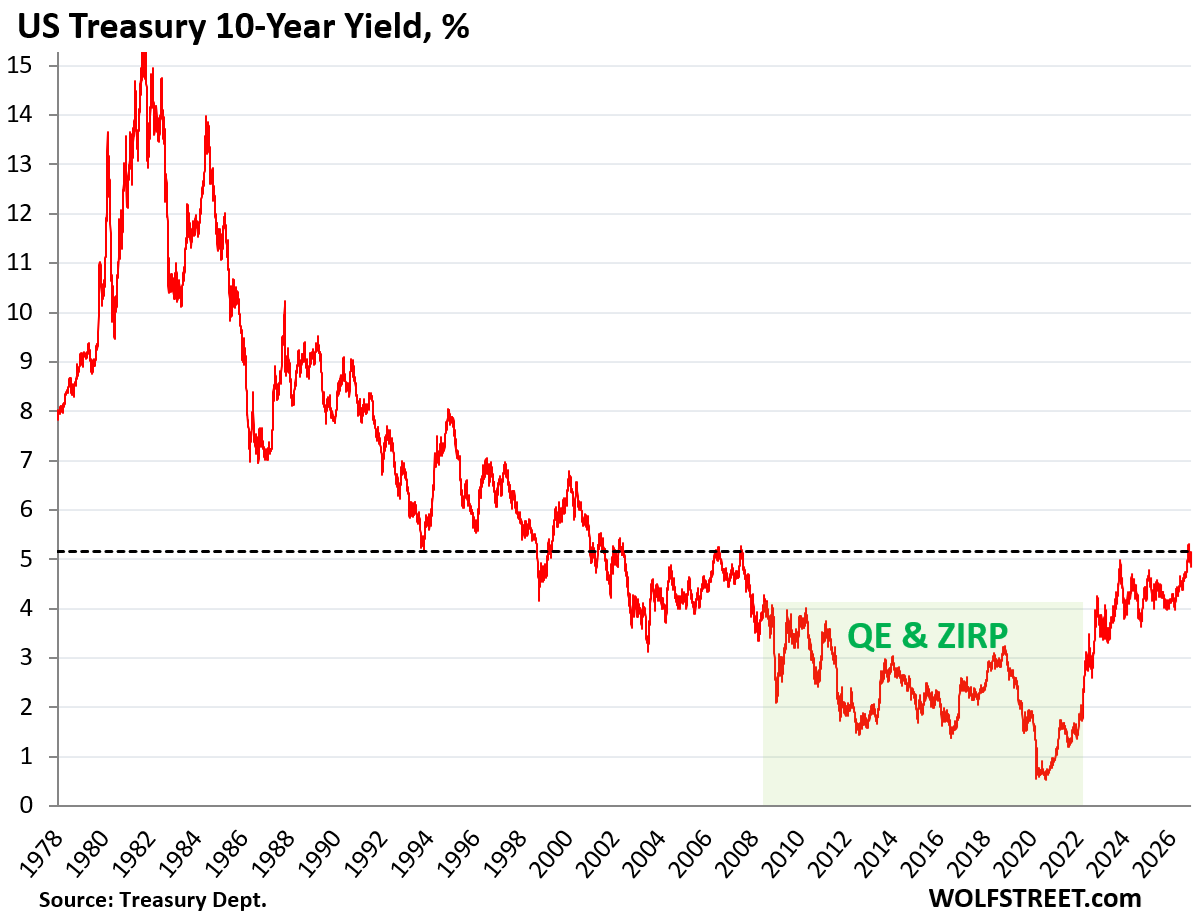
The long view of the 10-year Treasury yield shows that the trend higher for yields is intact. That four-week long dip in yields that ended on November 5 is barely visible among much bigger moves.
Yields in that 5.15% range were briefly seen in 2006 and 2007, but then prior to 2002 were considered low to impossibly low.
And with 4.0% CPI inflation, as is currently the case, a 10-year yield of 5.15% is below the “mildly attractive” line for this observer.
We’re now six years into the current bond bear market (when yields rise, bond prices fall), that followed the 40-year bond bull market from 1981 through August 2020 (when yields fall, bond prices rise).
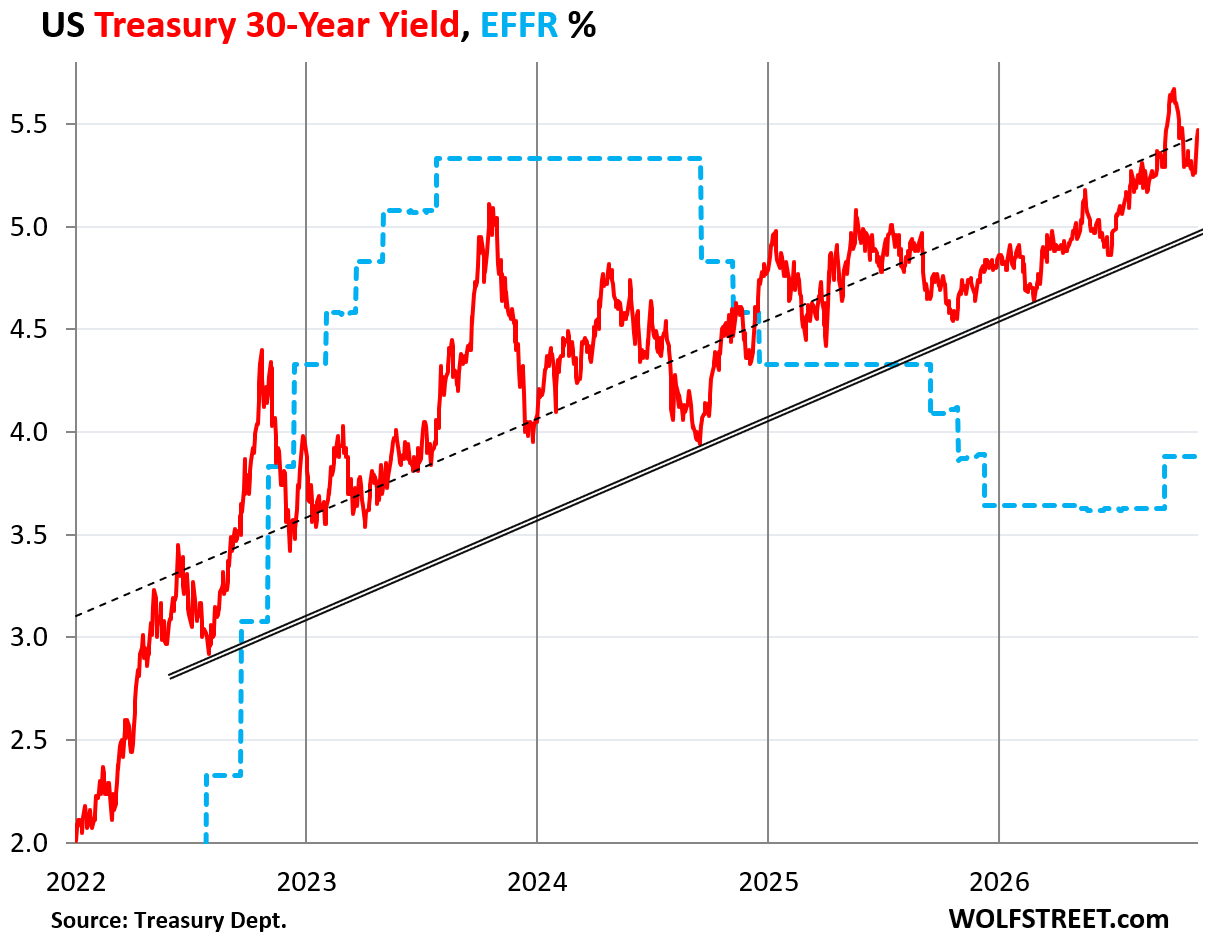
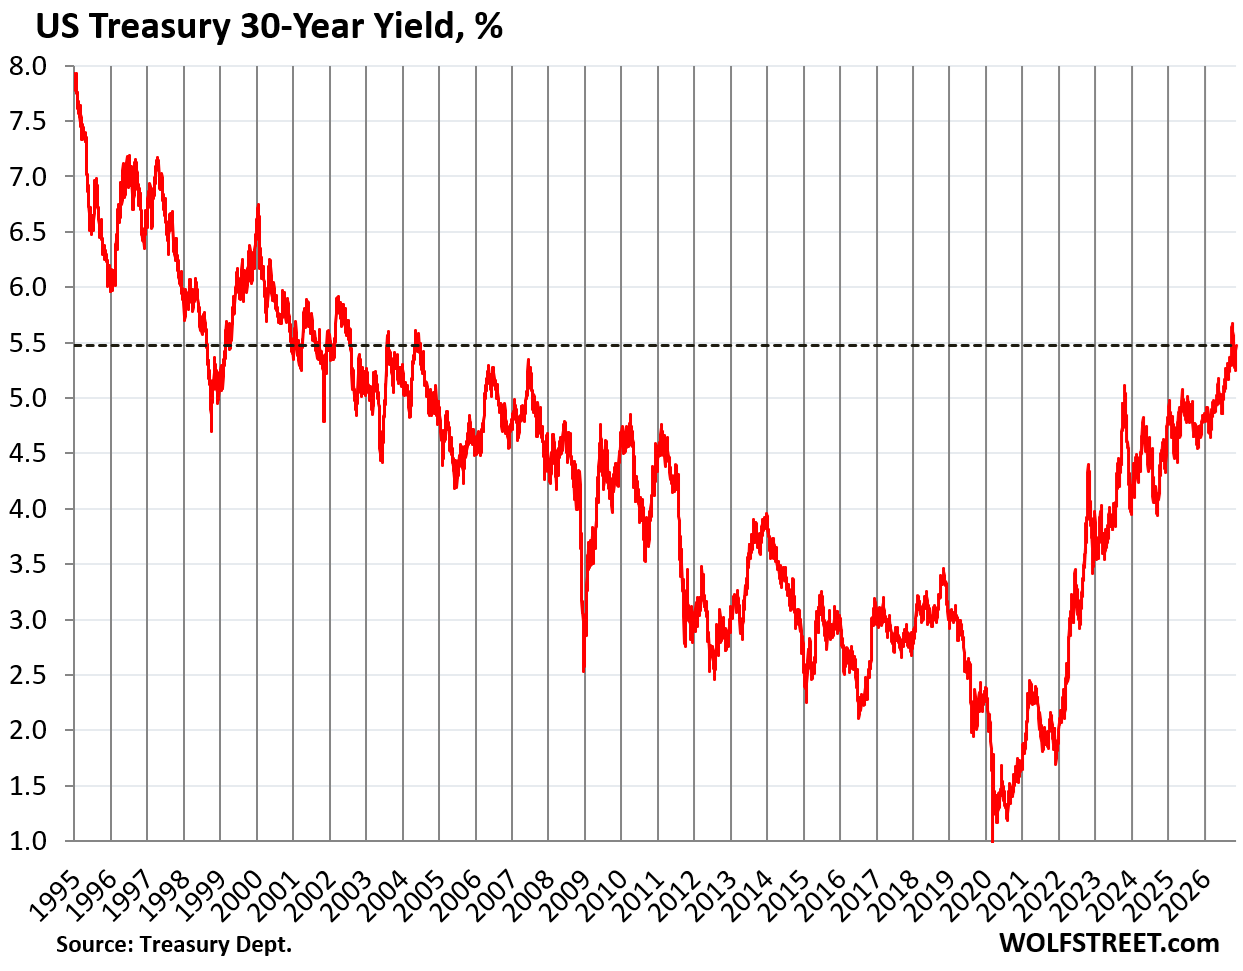
The 30-year Treasury yield rose by 21 basis points this week and by 25 basis points since Thursday last week, to 5.47%.
At the auction on Thursday, it took a yield of 5.44% for the government to sell all $30 billion of 30-year bonds. In the secondary market, the yield then rose further.
And the trend higher remains superbly intact. I’ve shown this chart for quite a while. Every single rally (when yields dropped) since 2023 was defeated at or before the black double-line, and yields then snapped back. Some day in the future, the yield will break through that black double-line substantially, and that may be a sign that the upward trend has run its course. But that hasn’t happened yet.
That rally through November 5 didn’t even get anywhere near the double-black line, and then it snapped back by 25 basis points to above the trend line (dotted black line), calculated from the yields in the time frame of the chart going back to 2022.
The long view of the 30-year Treasury yield shows that the recent yields were last seen, but only briefly, in 2003 and 2004, and there’d been a few days in October when the yield was the highest since 2002. But in the years before 2002, those kind of yields were considered low.
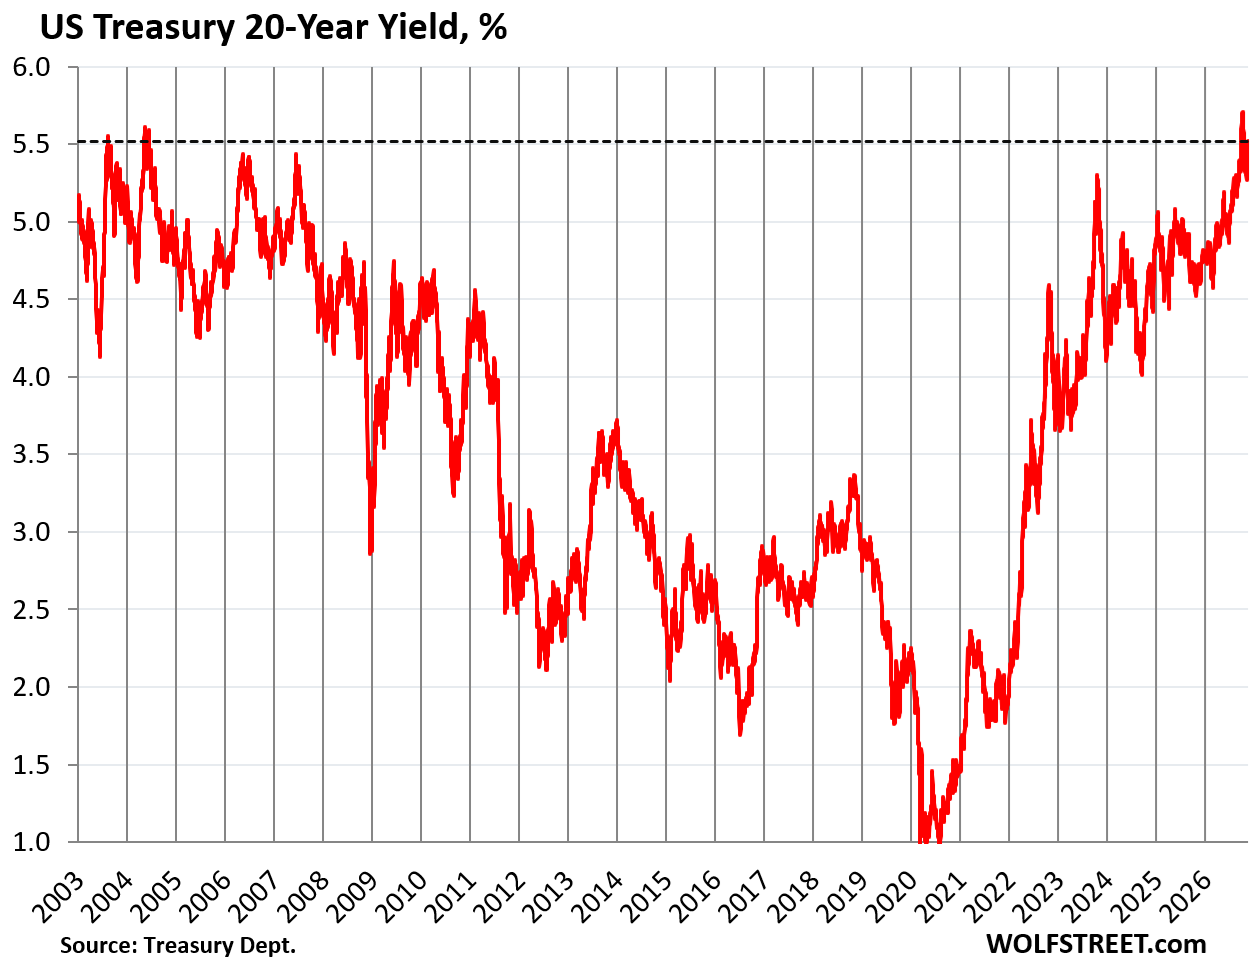
The 20-year Treasury yield closed on Friday at 5.52%. At the peak on October 7, it had traded at 5.71%.
The 20-year yield is always a little higher than the 30-year yield – despite the additional risks of the 30-year bond in form of the additional 10 years of duration. The issue is low liquidity in the secondary market: The 20-year bond was reintroduced in 2020, auctions are small, and there are not many of these bonds outstanding to trade, and they’re not easy to trade. Those liquidity issues matter for institutional traders because they make the bond harder to sell in large amounts, and can mean lower prices. But those liquidity issues are largely irrelevant for buy-and-hold investors.
There is a 20-year auction coming up next Wednesday, and a yield north of 5.52% would squeak over this observer’s “mildly attractive” line.
By contrast, the 30-year bond at this yield remains below the “mildly attractive” line due to the extra risks that come with the additional 10 years of duration. In this observer’s view, that extra 10-years of duration needs to be paid for. And it’s not.
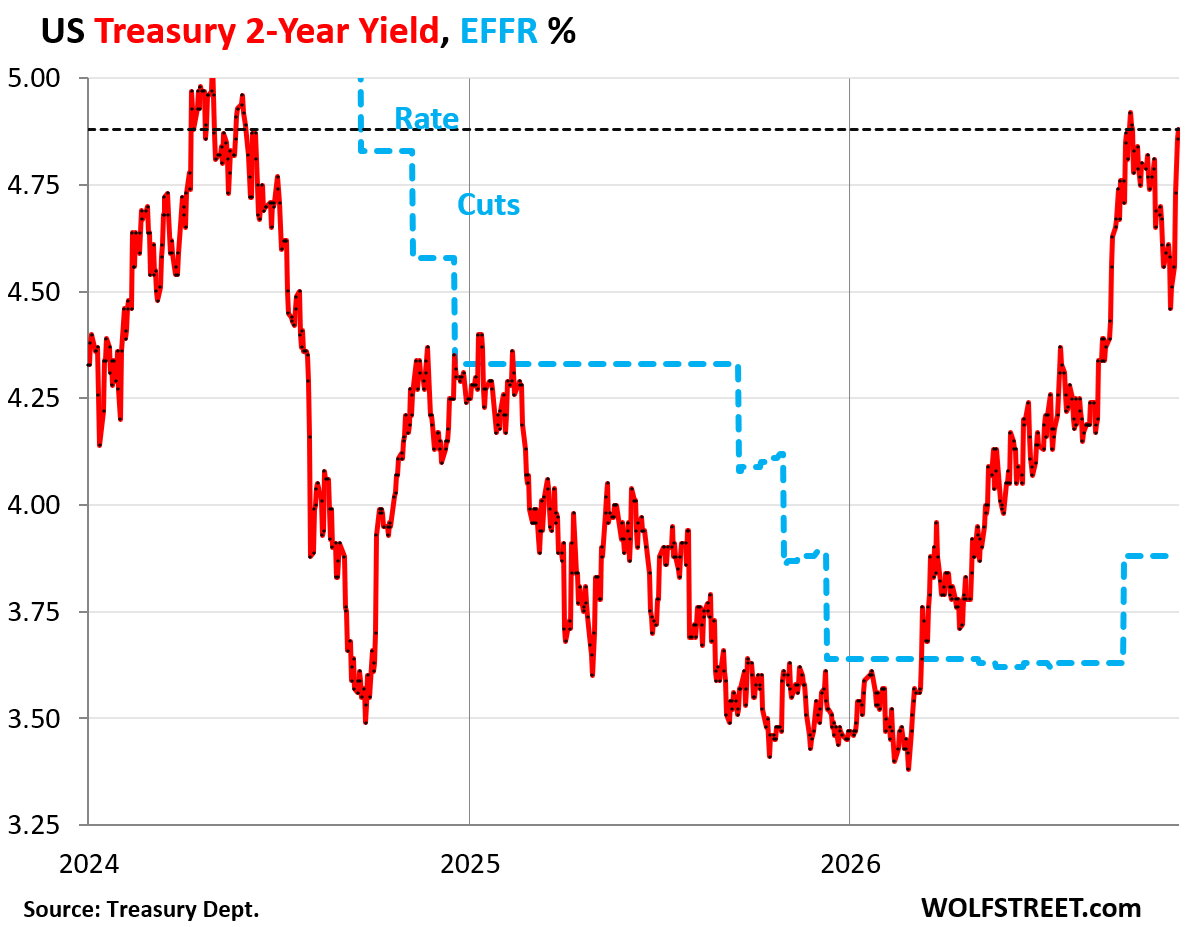
The 2-year Treasury yield spiked by 37 basis points during the week and by 42 basis points in six trading days since the low point on Thursday November 5, to 4.88%.
That 42 basis points in six days is a big move. It was driven by rate-hike expectations, which got dialed up. The 2-year yield is now again 100 basis points above the EFFR, indicating that the bond market sees multiple rate hikes.
Note how long it took for the 2-year yield to zigzag lower from 4.92% on September 28 to 4.46% on November 5, and how, in just 6 trading days, it snapped back nearly all the way:
The government sold $766 billion in Treasury securities this week, in nine auctions, condensed down to three days, with Wednesday having been a bond-market holiday and no auctions are held on Fridays.
In addition to the 10-year note auction and the 30-year bond auction mentioned above, the government held a 3-year note auction and six Treasury bill auctions.
The note and bond auctions totaled $150 billion.
| Treasury note and bond auctions this week: | |||
| Notes & Bonds |
Auction date |
Billion $ |
Auction yield |
| Notes 3-year |
Nov-09 |
70 |
4.627% |
| Notes 10-year |
Nov-10 |
50 |
5.020% |
| Bonds 30-year |
Nov-12 |
30 |
5.441% |
| Notes & bonds |
150 |
||
The six T-bill auctions totaled $616 billion.
| Treasury bill auctions this week: | ||||
| Type | Auction date |
Billion $ |
High Rate |
Investment Rate |
| Bills 4-week | Nov-12 |
123 |
3.955% |
4.022% |
| Bills 6-week | Nov-09 |
107 |
3.990% |
4.064% |
| Bills 8-week | Nov-12 |
117 |
4.080% |
4.163% |
| Bills 13-week | Nov-09 |
101 |
4.060% |
4.159% |
| Bills 17-week | Nov-12 |
80 |
4.225% |
4.344% |
| Bills 26-week | Nov-09 |
87 |
4.145% |
4.293% |
| Total T-bills |
616 |
|||
Short-term treasury yields have also surged during the week in the secondary market as rate hike expectations were dialed up, and ended on Friday a higher than their respective auction yields during the week.
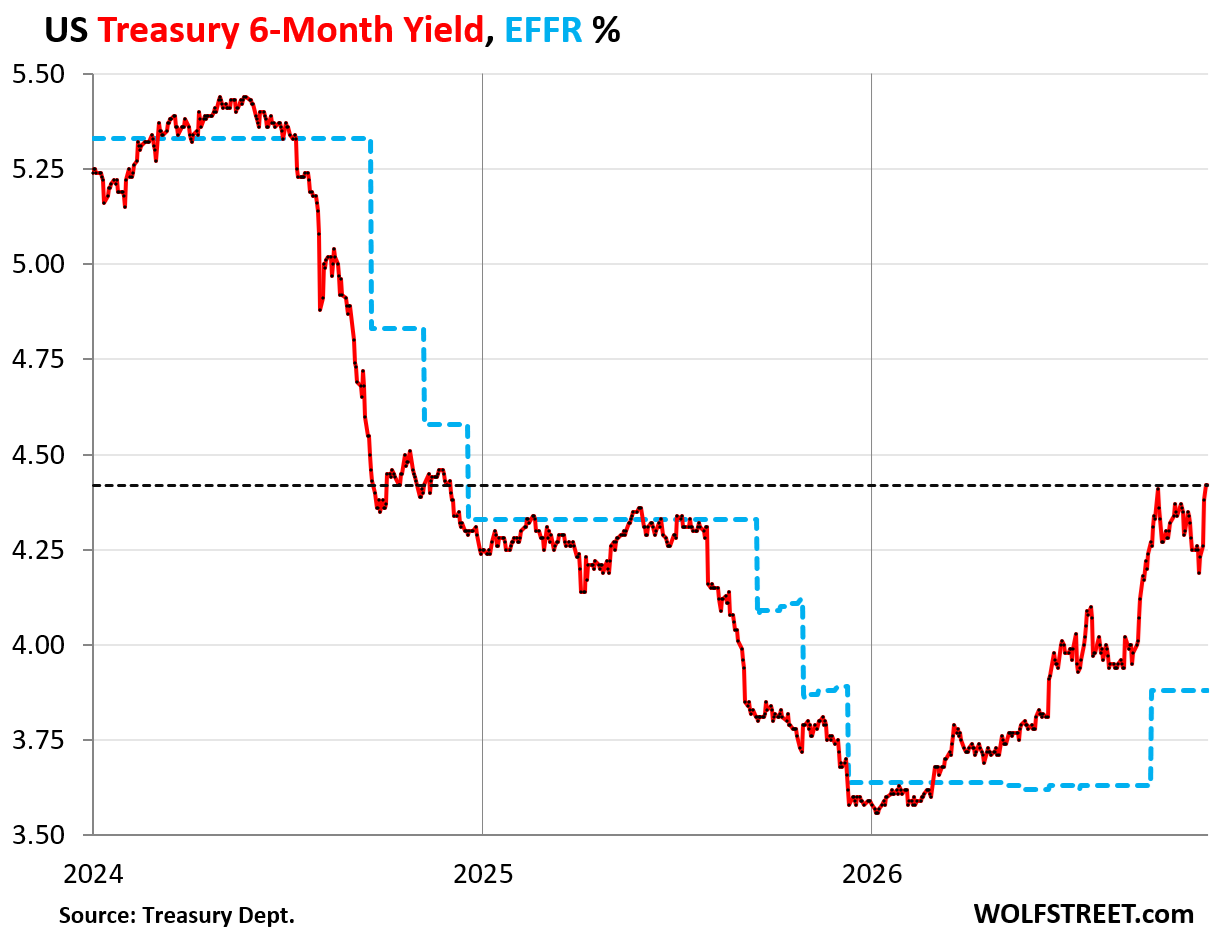
The 6-month Treasury yield spiked by 23 basis points from the low point on Thursday last week.
At the 6-month T-bill auction on Monday, the “high rate” (figured on a discount basis) was 4.145% and the “investment rate” (figured as if it were a coupon Treasury security and is closer to secondary market yields) was 4.293%. That was the auction on Monday.
By Friday evening, the 6-month yield in the secondary market had risen to 4.42%, the highest since December 2024, when the Fed was cutting rates and short-term yields were falling along with the rate cuts.
The 6-month yield is now 54 basis points above the EFFR, indicating that buyers and sellers in the bond market traded with an expectation of 2 rate hikes over the next few months.
Enjoy reading WOLF STREET and want to support it? You can donate. I appreciate it immensely. Click on the mug to find out how: