

Bitcoin Cash ($BCH) slipped under $300 on Friday, retreating 7% over the past 24 hours and flirting with a multi-month low as risk sentiment rippled across cryptocurrency markets.
Early trading saw $BCH test support near $293, a level that coincided with broad weakness in Bitcoin, which traded close to $73,000.
Growing downside pressure for $BCH comes as technical indicators and macro developments combine to sap momentum.
$BCH slumps amid Bitcoin price dip
The latest pullback in $BCH occurred against a backdrop of weakness among major cryptocurrencies.
Bitcoin posted notable declines this week, dipping below $73,000 at multiple points and triggering sell-offs across top tokens.
Ether fell beneath the $2,000 threshold, while Solana slid toward $80, amplifying losses among large-cap altcoins.
Traders attributed part of the sell-off to an uptick in risk-off positioning tied to geopolitical tensions, notably the escalating US–Iran conflict, which has undermined appetite for risk assets and reduced liquidity in crypto markets.
As Bitcoin’s intraday volatility increased, $BCH surrendered recent gains and revisited intraday lows around $293.
Analysts noted that Bitcoin Cash’s correlation with Bitcoin remains high, and any extended weakness in $BTC could continue to pressure $BCH.
Short-term traders responding to $BTC’s declines trimmed long positions across altcoins, accelerating the downtrend in $BCH volumes and contributing to thinner order books near support levels.
Bitcoin Cash technical setup
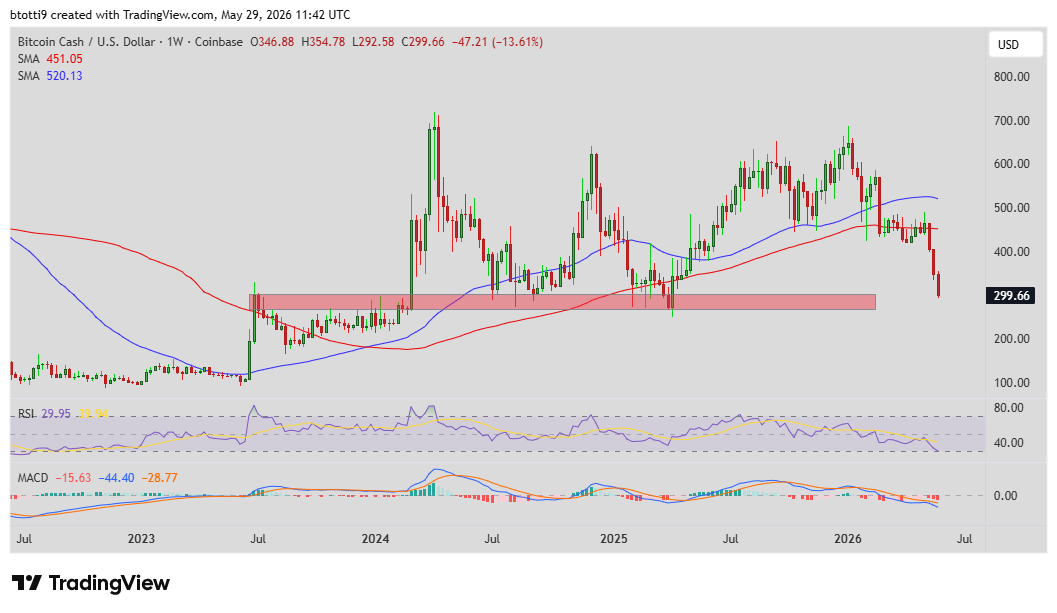
Technical charts for Bitcoin Cash paint a cautiously bearish picture.
$BCH has printed three consecutive red candles on the weekly chart after a sharp reversal from the mid-May high above $465, where the token traded on May 11, 2026.
The subsequent slide shows the token trading below critical moving averages, including SMA-50, SMA-100, and SMA-200.
$BCH could face significant hurdles at each of the levels, which are now acting as resistance in the event of a rebound.
Momentum indicators support this outlook, with the Relative Strength Index (RSI) declining toward oversold territory, and the Moving Average Convergence Divergence (MACD) continuing to favour bearish momentum.
Could $BCH crash to $260?
The technical picture suggests that a failure to hold the $290 support zone could expose $BCH to a deeper correction toward levels not seen since March 2025.
In this case, a revisit of those lows around $260 is possible if sellers intensify and liquidity remains constrained.
Such a move would mark a substantial retracement from the May highs and could prompt renewed defensive positioning among institutional and retail holders.
Conversely, a sustained recovery in Bitcoin would be the most direct path to stabilizing $BCH.
Analysts say that a decisive reclaiming of $73,500-$75,000 for $BTC could dampen risk-off behaviour, encouraging flows back into altcoins and offering $BCH an opportunity to retest its moving averages.
Until then, the technical setup and prevailing macro risks suggest limited upside and heightened downside vulnerability for Bitcoin Cash.